

Today we have the honour to introduce Sérgio Freire as our guest. Sérgio Freire is a Geographer, currently working as Scientific/Technical Project Manager at the European Commission’s Joint Research Centre (JRC), Directorate E. Space, Security and Migration, Disaster Risk Management Unit, based in Ispra, Italy. His main activities focus on developing applications of the JRC’s Global Human Settlement Layer (GHSL) in the context of disaster exposure, risk, and vulnerability analysis, including modelling population distribution at a range of spatial and temporal resolutions. Current activities also include global mapping and characterisation of human settlements, and developing satellite-based indicators to support monitoring of Sustainable Development Goals.
- When we think about disasters, we firstly mean natural hazards characteristics. However, potential harm comes even from vulnerability and exposure. Can you please explain to us what these elements are and which role they play in the risk equation?
In fact, natural hazards are ‘normal’ acts of nature that are part of the living planet that is Earth.
These only make the news and become disasters when they affect people (or property, systems) that display vulnerabilities to those specific phenomena. A strong earthquake in the middle of the Sahara desert may have little or no impacts due to scarce population and settlements, i.e., the absence of exposure. On the other hand, an earthquake of comparable magnitude occurring in cities of dissimilar countries may cause very different impacts and casualties due to the divergent structural vulnerabilities of built-up structures. However, for extreme events or hazards above a certain magnitude, exposure is a major driver of impacts.
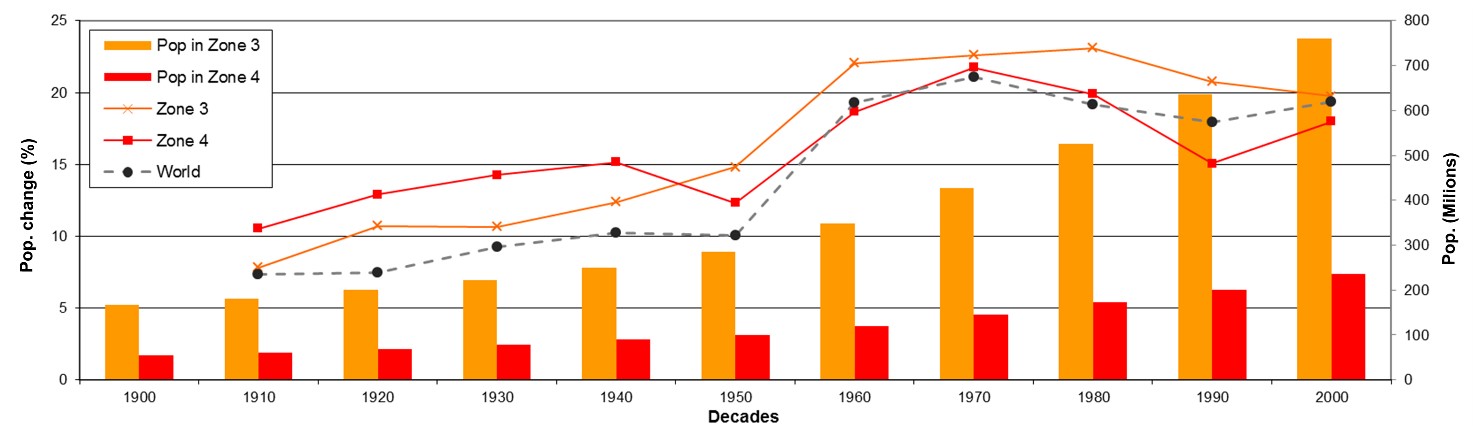
Figure 1. Evolution of global population exposed to the highest seismic hazard, by decade. Bars refer to the total population in Modified Mercalli Intensity levels VIII to XII (right axis) and lines refer to percent population change relative to the previous period (left axis) (Source: Freire S., D. Ehrlich, S. Ferri, 2015. Population Exposure and Impacts from Earthquakes: Assessing Spatio-temporal Changes in the XX Century. Computer Modeling in Engineering & Sciences (CMES), SI: ‘Modeling of dangerous phenomena for risk mitigation’. Vol.109(2): 159-182)
- Why do we need to identify and model population and human settlements dynamics for Disaster Risk Reduction?
As said above, exposure is a core component of disaster risk, without which there would be no impacts from hazards. Also, for some types of natural hazards, risk can only be significantly reduced by decreasing exposure and vulnerability, as the hazard component of the equation is quite inflexible. For example, earthquakes and volcanic eruptions are still difficult to predict and we cannot reduce the magnitude of events.
Since people are the most vital asset to protect, adequate planning, mitigation, and reaction to disasters requires knowing the location of people and their characteristics. Geospatial data on population and human settlements is fundamental to know where and how we live. Then reducing disaster risk requires taking informed decisions. However, there is still much to be known about the global distribution of population and settlements and how this has been changing and may evolve in the future. We still don’t know with sufficient detail and consistency how people and settlements occupy the planet, let alone their characteristics that may determine final impacts from hazards. Some regions are still poorly mapped, and available statistics suffer from high uncertainty.
Also, hazard events are often unexpected and can strike at any time, day or night. However, when we do map human exposure, is usually a static picture that typically represents one moment in time (e.g. nighttime population distribution if based on census data).
In the frame of the ENACT project, for the first time, it was possible to map population dynamics in the daily and seasonal cycles for a large geographical area such as the 28 countries of the EU, where 500 million people conduct their activities. We believe such new data has the potential to significantly advance DRR.
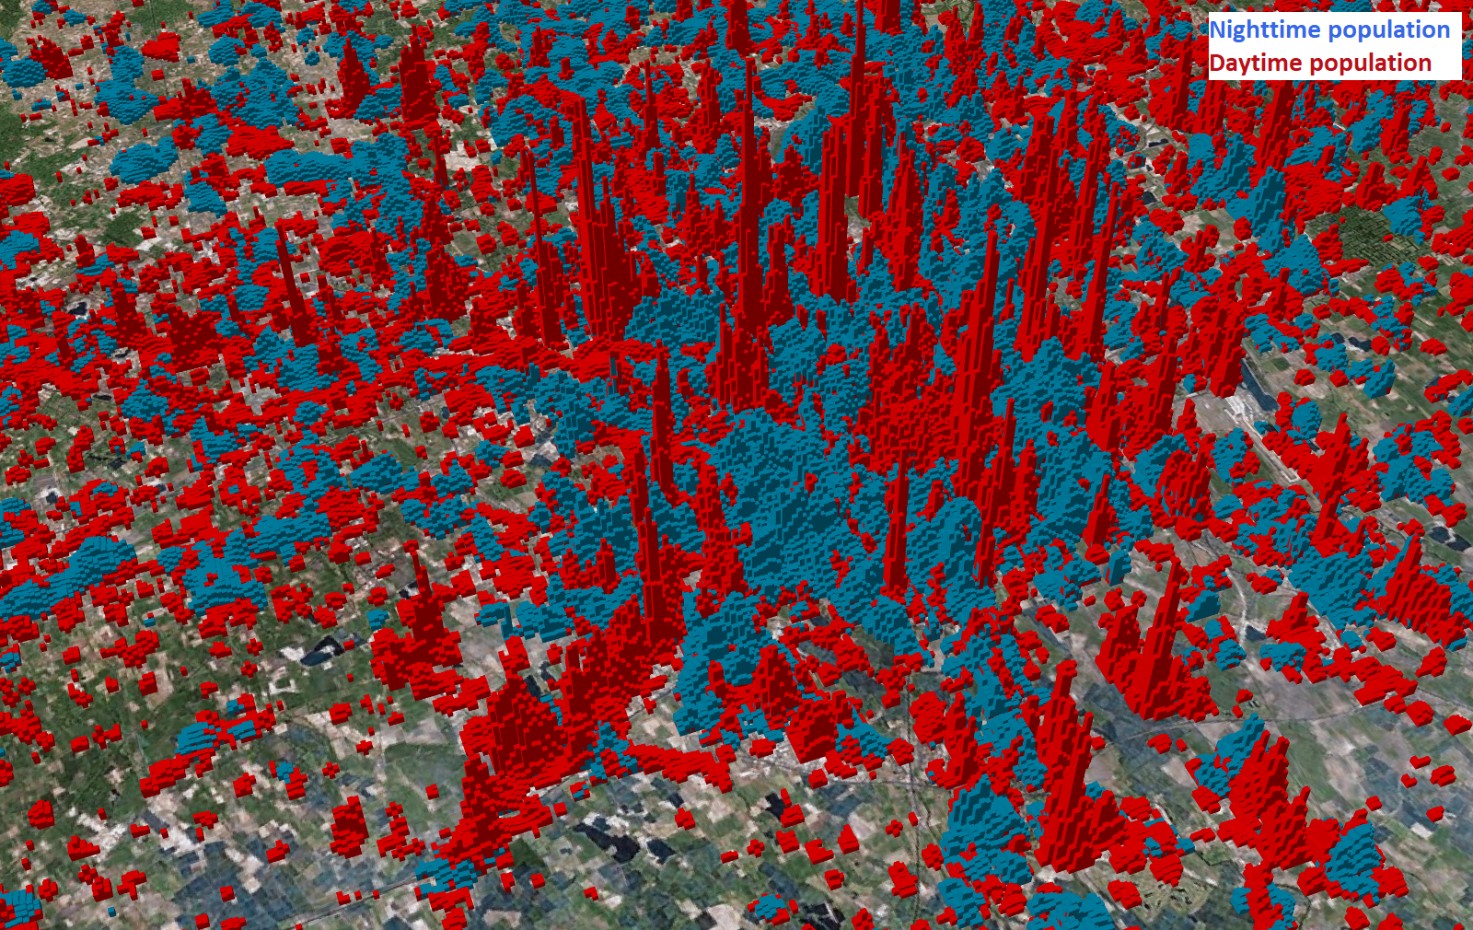
Figure 2. 3D representation of population densities in Milan (Italy) by 1km cells in nighttime (blue) vs. daytime periods (red), based on data from the ENACT project. Source: EC-JRC ENACT project, ©2018
- Which are the instruments that are used to track population and buildings distribution?
For tracking in a cost-effective and consistent way the distribution of population and buildings for wide areas (countries, continents), remote sensing data (i.e. satellite imagery) are definitely a fundamental data source, as these technologies allow to ‘see’ and map inaccessible, very large, or highly dynamic areas of the globe. Their significance is increasing as both new information extraction methods and sensors become available, in a full open-and-free frame (e.g. Sentinel satellites of the EU Copernicus Programme).
The GHSL project has relied heavily on satellite imagery as baseline data source to map global built-up, population and settlements in the last 40 years (1975-2015). An open and free frame is crucial to promote transparency of methods, to broaden the range of applications, and to ensure widespread access to data and information, including by poorer countries. But there are limits to the amount of information that remote sensing can collect, in terms of the number, characteristics of people and their activities. Then richer and more detailed geospatial information can be produced by combining remote sensing data with available conventional (e.g. official statistics, maps) and non-conventional data sources (e.g. from VGI, social media, mobile phones). This has been demonstrated by the ENACT project. Of course, all data sources should be used in an anonymized and aggregated way, respecting people’s right to privacy.
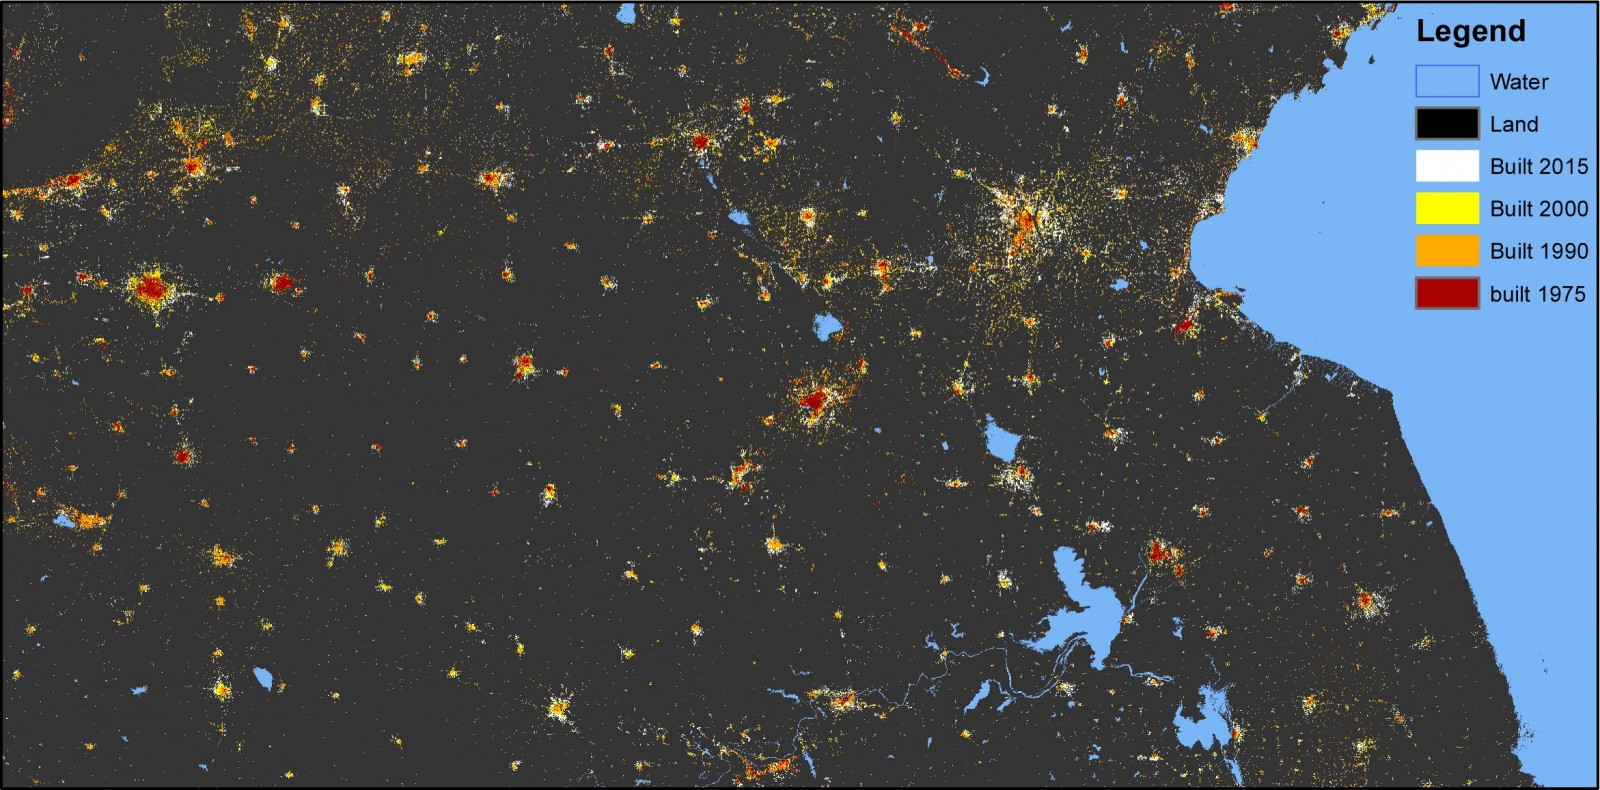
Figure 3. GHSL mapping of built-up areas from Landsat imagery in the epochs 1975-1990-2000-2015. Source: EC-JRC GHSL data, ©2018.
- At a local level, how this information can be useful and which actions policymakers may undertake?
At the local level, this information can be useful for having a more complete, updated, and consistent picture of the reality, that may be more comparable across administrative units (e.g. neighbouring municipalities). Especially when there is a temporal component to this information (i.e. comparable maps produced for different points in time), it allows policymakers to visualize and quantify settlement and development trends, and to consider the effects of planning actions or inactions.
In terms of Disaster Risk Reduction and in a context of generalized population growth, it is especially important that decision-makers avoid creation of new risk, by limiting urban expansion and concentration of people and assets in areas more prone to hazard events (i.e. flood plains, low elevation coastal areas, vicinity of fault lines, etc.).
- At a global level, how this information can help to meet the SDGs?
The Sustainable Development Goals (SDGs) are mostly about improving people’s lives and their communities. Achieving the broad goals entails reaching specific targets supported by indicators. These indicators are ‘action-oriented, global in nature and universally applicable’ and should be sustainable and comparable across space and time, so performance towards the targets can be monitored.
Ideally, the indicators supporting the international development agenda should be based on population geospatial data that is up-to-date, sufficiently detailed, consistent, cost-effective (i.e. repeatable), transparent (i.e. using clear methods), and accessible to all. In fact, the population is a denominator under the Sustainable Development Goal 11 ‘Make cities and human settlements inclusive, safe, resilient and sustainable’ with specifically:
- Indicator 11.3.1: ‘Ratio of land consumption rate to population growth rate’ under the target of enhancing by 2030 an integrated and sustainable human settlement planning and management;
- Indicator 11.5.1: ‘Number of deaths, missing persons and persons affected by disaster per 100,000 people’ under the target of reducing by 2030 the number of deaths and the number of people affected, decreasing the direct economic losses caused by disasters.
The post-2015 international development agreements place great demands and responsibility on geospatial data, in particular on that related to population and settlements, and offers an opportunity for improving data quality, so no one is left behind also due to information gaps.
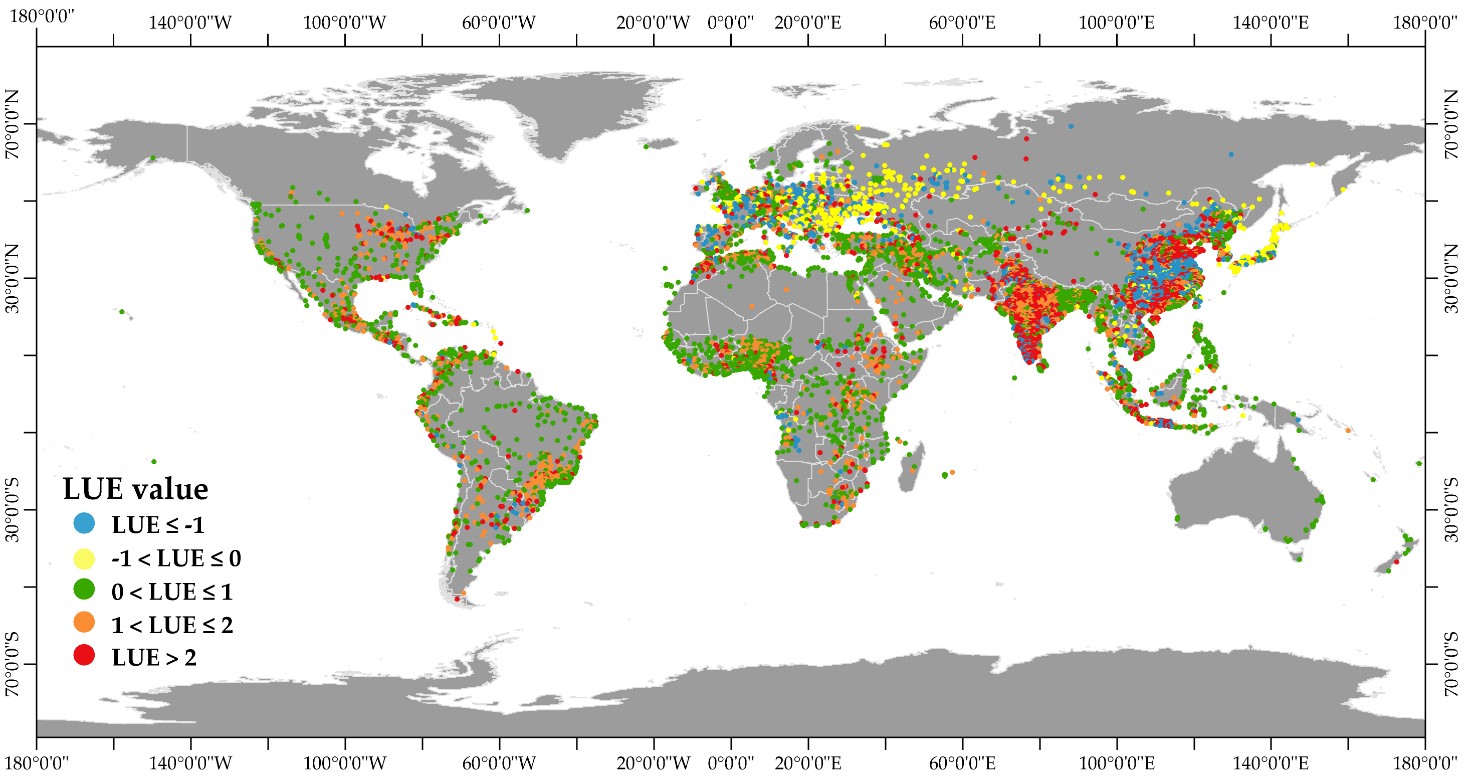
Figure 4. Land Use Efficiency (LUE) computed for circa 10,000 urban centres in the period 1990-2015 using GHSL data. Source: Melchiorri, M., M. Pesaresi, Aneta J. Florczyk, C. Corbane, and T. Kemper. “Principles and Applications of the Global Human Settlement Layer as Baseline for the Land Use Efficiency Indicator –SDG 11.3.1.” International Journal of Geographical Information Science (submitted). EC-JRC GHSL data, ©2018.
If you want to know more, check this additional video about GHSL:
Ana Fonseca
Grande Sérgio Freire!! Felicidades e muito sucesso.
Zoe Miller
Hey Giulia! I just finished reading your article on mapping population dynamics for disaster risk management, and I have to say, it was an enlightening read. The way you broke down the importance of integrating population data with disaster risk assessments really hit home. It’s amazing how much more effective disaster response can be when we have a clear understanding of where people are most vulnerable. Your point about using high-resolution population data to pinpoint areas in need of the most support during disasters is spot on. Kudos to you for shedding light on such a crucial aspect of disaster management!
Sign Company Perth
This article brilliantly highlights the crucial role of mapping population dynamics in advancing disaster risk management. By integrating population data with hazard assessments, we can better prepare and respond to disasters, ultimately saving lives and reducing economic impacts. This approach not only enhances our understanding of vulnerable populations but also informs more effective and equitable disaster response strategies. A significant step forward in disaster risk management!