There is a quiet contradiction at the heart of natural hazard science. The regions most exposed to multi-hazard events are precisely the regions where we know the least. The Global South (comprising lower- and middle-income countries in Africa, Asia, Latin America and the Caribbean) is disproportionately affected by climate-related natural hazards, yet it is largely underrepresented in climate research and published literature [1]. Flood-exposed populations in the Global South are projected to be nearly five times greater than in the Global North (comprising, high-income countries in Europe, North America, and Australasia) by the end of the century [2], and compound hot-dry extremes are rising fastest in Asia, the Middle East, and Africa, amplified by large populations, lower income levels, and socio-economic vulnerability [3]. Sparse gauge networks, coarse-resolution soil data, incomplete hazard inventories, and a lack of high-resolution topography data. And yet, climate extremes are intensifying in these regions faster than our data infrastructure can keep up. We have built sophisticated multi-hazard models. We just rarely have the data to run them with integrity.
The multi-hazard problem is not what you think
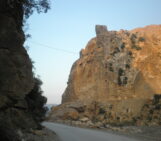
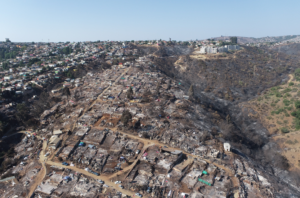
Multi-hazard modelling is often framed as a problem of complexity: how do you represent the interactions between hazards within a single coherent framework? That is a real challenge, and a well-documented one [4, 5, 6, 7, 8, 9]. But in data-scarce regions, the harder problem comes before the modelling even starts. Consider a post-wildfire catchment in coastal Chile (Fig. 1). The February 2024 mega-wildfire in the Marga-Marga catchment in Viña del Mar, one of the most destructive in Chilean history, burned through densely urbanised slopes and fundamentally altered the hazard setting [10]. A wildfire removes vegetation; changes soil hydrological and stability properties and dramatically alters infiltration and rainfall-runoff dynamics. The next rainfall event in the Marga-Marga catchment, increasingly intense under a changing climate, triggers erosion, shallow landslides, and hyper-concentrated flows simultaneously. These are not independent hazards. As described by [11] and [12], they interact in concurrent, compounding and cascading ways, amplifying their impacts when treated as single hazards. Treating them in isolation is not conservative; it is wrong.
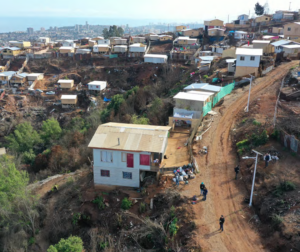
Figure 1 (left to right). The Marga-Marga catchment in Viña del Mar: the effects of wildfires on urbanisation and hillslope vegetation, and wildfire-affected settlements
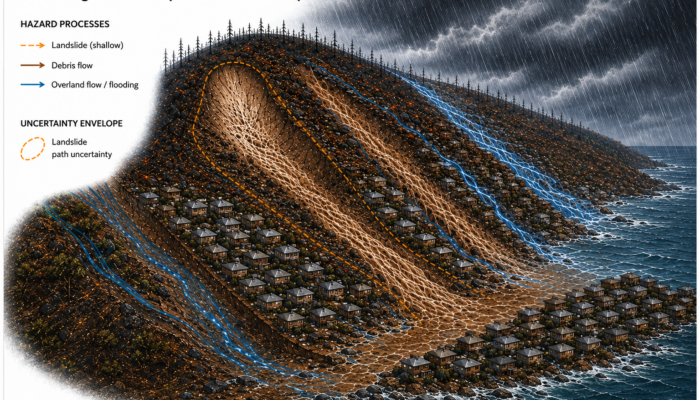
But to model these multi-hazard interactions jointly (Fig. 2), you need to know when and where they occur. This requires spatially distributed multi-hazard models, which are inherently complex due to high data demands, parameterisation requirements, and the need to represent spatially and temporally interacting physical processes. Therefore, to assess post-wildfire multi-hazard interactions we need high-resolution topography, pre- and post-fire soil properties, sub-hourly rainfall, and a multi-hazard inventory for validation. In data-scarce regions, you typically have none of these at the quality multi-hazard models demand. You have a 30-metre Digital Elevation Model (DEM), ERA5 reanalysis at 9 km, SoilGrids estimates derived from Machine Learning (ML) models trained elsewhere, and a landslide inventory assembled after the disaster from satellite imagery and newspaper reports, if anything exists at all. In Chile, as across much of the Global South, official hazard records are often discontinued, incomplete, or simply absent. Acknowledging these limitations is not a reason to stop modelling. It is the first step toward transparent modelling. But recognising the data problem is only half the story. The other half is understanding what happens inside the model once you ignore it.
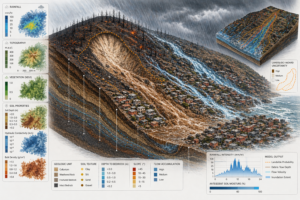
Figure 2. Conceptual representation of post-wildfire cascading hazards (landslide, debris flow, and flooding) and associated data requirements for integrated multi-hazard modelling. Illustration generated using ChatGPT (Open AI).
The uncertainty cascade
The data problem in multi-hazard modelling is not only about gaps. It is also about how uncertainty propagates. Every step of the modelling process carries its own uncertainty: estimating soil properties, resampling spatial resolution, disaggregating daily rainfall to sub-hourly intervals, selecting the model structure and validating it against an incomplete hazard inventory. Crucially, these uncertainties do not simply add together; they multiply.
In post-wildfire multi-hazard settings, where we want to understand the effects of hazard interactions on landslides, debris flows, and hillslope erosion, this uncertainty cascade misrepresents key processes such as infiltration, pore pressure, and shear strength, which are essential drivers of hydrology and slope stability, distorting both the predicted location and magnitude of each hazard and the interactions between them. [13] and [14] demonstrate that quantifying this rigorously requires an ensemble of simulations rather than a single model run, as formalised in the GLUE framework (Generalised Likelihood Uncertainty Estimation). That is, many different parameter sets can reproduce observed hazard behaviour equally well, a problem known as equifinality. In data-scarce regions, where observations are few and data are uncertain, this approach does not weaken the analysis; it is the only honest way to represent what the data actually tells us about the plausible range of hazard behaviour.
What honest multi-hazard modelling looks like in practice
A hazard map is a static product: a single model run and a single moment in time, with uncertainty hidden behind clean colour gradients.
The answer to the uncertainty cascade is not to abandon physically-based modelling in data-scarce regions. It is to structure the modelling workflow around it. [15] argues that uncertainty-aware modelling in data-limited environments requires explicit decisions at every step: which data sources are used and what uncertainty they carry, which parameter ranges are physically plausible given the available data, which model runs are retained as behavioural and which are rejected, and how the resulting ensemble is communicated to decision-makers.
But this does not stop here. Climate change introduces an additional dimension: The rainfall events that trigger post-wildfire multi-hazard events are becoming more intense and frequent. This means that the set of behavioural parameters identified through GLUE are not only a tool for reproducing past observations but also provides a basis for evaluating how hazard behaviour responds to future rainfall extremes. The workflow itself becomes the scientific contribution: it makes the path from uncertain data to decision-relevant output transparent and reproducible decision-making.
My own work on post-wildfire hazard in the Marga-Marga catchment has made this concrete. Building on research conducted at CIGIDEN (National Research Centre for Integrated Natural Disaster Management, Chile). I ran a physically-based multi-hazard model (OpenLISEM Hazard) across hundreds of parameter combinations. I varied soil cohesion, hydraulic conductivity, porosity and friction angle. I used Earth observation datasets as the best available proxy for unmeasured field conditions. The model produced hazard outputs that communicated confidence ranges rather than false certainty. This approach is more computationally demanding than a single model run, but it is the only defensible method given our current knowledge.
This points toward a distinction the field rarely makes explicit. A hazard map is a static product: a single model run and a single moment in time, with uncertainty hidden behind clean colour gradients. What I am describing is different: geospatial hazard intelligence, which has the capacity to transform uncertain, spatially distributed data into honest, decision-relevant knowledge about where hazards occur, how they interact and how confident we are in that assessment. Confidence is not an afterthought; it is the core deliverable. The output is not designed for archiving, but for the person who has to decide whether to rebuild a school on a hillslope after a wildfire, or whether to evacuate a neighbourhood before the next one.
In regions where data are scarce, that distinction is not academic. The mega-wildfire in the Marga-Marga catchment destroyed around 5,500 homes across the densely populated slopes of Viña del Mar and neighbouring municipalities, triggering a reconstruction process estimated to cost one billion dollars [16]. Decisions about where to rebuild, which slopes were safe to reoccupy and which sites posed an elevated risk of post-wildfire landslides and debris flows were made on the same burned terrain, with the same missing data and under enormous political and social pressure to act quickly. Most rebuilding was carried out through residents’ self-reconstruction efforts, largely outside the scope of formal hazard assessment [10]. A multi-hazard assessment that communicated not just the level of risk, but also the reliability of the assessment, could have informed which sites were recoverable and which were not. Such an assessment did not exist. Honest communication of uncertainty is not a weakness; it is the most actionable thing a model can produce. Hiding uncertainty is what causes disasters to happen twice in the same place.
The hazards compound. The data doesn’t. Our methods must close that gap, and our outputs must reflect this.
References
[1] N. Communications, “Climate research in the Global South,” Nat. Commun., vol. 16, no. 1, pp. 3–4, 2025, doi: 10.1038/s41467-025-63884-3.
[2] Q.Zhang et al., “Global South shows higher urban flood exposures than the Global North under current and future scenarios,” Commun. Earth Environ., vol. 6, no. 1, pp. 1–13, 2025, doi: 10.1038/s43247-025-02585-7.
[3] J. Guo et al., “Rising compound hot-dry extremes engendering more inequality in human exposure risks,” npj Natural Hazards, vol. 2, no. 1, pp. 1–11, 2025, doi: 10.1038/s44304-025-00119-x.
[4] S. De Angeli, B. D. Malamud, L. Rossi, F. E. Taylor, E. Trasforini, and R. Rudari, “A multi-hazard framework for spatial-temporal impact analysis,” International Journal of Disaster Risk Reduction, vol. 73, p. 102829, Apr. 2022, doi: 10.1016/j.ijdrr.2022.102829.
[5] J. C. Gill and B. D. Malamud, “Hazard interactions and interaction networks (cascades) within multi-hazard methodologies,” Earth System Dynamics, vol. 7, no. 3, pp. 659–679, 2016, doi: 10.5194/esd-7-659-2016.
[6] S. Hochrainer-Stigler et al., “Toward a framework for systemic multi-hazard and multi-risk assessment and management,” iScience, vol. 26, no. 5, p. 106736, May 2023, doi: 10.1016/j.isci.2023.106736.
[7] M. Kappes, M. Keiler, K. von Elverfeldt, and T. Glade, “Challenges of analyzing multi-hazard risk: A review,” Nov. 31, 2012. doi: 10.1007/s11069-012-0294-2.
[8] R. Š. Trogrlić et al., “Challenges in assessing and managing multi-hazard risks: A European stakeholders perspective,” Environ. Sci. Policy, vol. 157, no. August 2023, 2024, doi: 10.1016/j.envsci.2024.103774.
[9] A. Tilloy, B. D. Malamud, H. Winter, and A. Joly-Laugel, “A review of quantification methodologies for multi-hazard interrelationships,” Sep. 01, 2019, Elsevier B.V. doi: 10.1016/j.earscirev.2019.102881.
[10] Martínez et al., “Incendios 02 y 03 de febrero de 2024, Viña del Mar (Región de Valparaíso),” 2024. [Online]. Available: https://www.cigiden.cl/wp-content/uploads/2024/02/CIGIDEN_2024_IncendiosVinadelMar_v04.pdf [Accessed: 3 June 2026].
[11] J. C. Gill and B. D. Malamud, “Reviewing and visualizing the interactions of natural hazards,” Reviews of Geophysics, vol. 52, no. 4, pp. 680–722, Dec. 2014, doi: 10.1002/2013RG000445.
[12] J. Zscheischler et al., “A typology of compound weather and climate events,” Nat. Rev. Earth Environ., pp. 1–15, Jun. 2020, doi: 10.1038/s43017-020-0060-z.
[13] K. Beven, “A manifesto for the equifinality thesis,” J. Hydrol. (Amst)., vol. 320, no. 1–2, pp. 18–36, Mar. 2006, doi: 10.1016/j.jhydrol.2005.07.007.
[14] K. Beven and A. Binley, “The future of distributed models: Model calibration and uncertainty prediction,” Hydrol. Process., vol. 6, no. 3, pp. 279–298, Jul. 1992, doi: 10.1002/hyp.3360060305.
[15] K. Beven et al., “Epistemic uncertainties and natural hazard risk assessment – Part 2: What should constitute good practice?,” Natural Hazards and Earth System Sciences, vol. 18, no. 10, pp. 2769–2783, Oct. 2018, doi: 10.5194/nhess-18-2769-2018.
[16] UNICEF, “Chile Humanitarian Flash Report No.2 (Wildfires),” 2024. [Online]. Available: https://reliefweb.int/report/chile/unicef-chile-humanitarian-flash-report-no2-wildfires-07-march-2024 [Accessed: 3 June 2026].
Blog post edited by: Hedieh Soltanpour and Harriet Thampson