
Intense rainfall lasting only a few hours is often enough to trigger natural hazards such as flash floods and landslides, leading to severe damage to infrastructure. These short-lived events are among the most dangerous natural hazards in the Mediterranean region, yet they are also among the hardest to study. Their small spatial scale and brief duration mean that they are often missed or underestimated by traditional climate datasets. Understanding how their frequency and intensity are changing is therefore crucial for risk assessment and adaptation planning.
In a recent study focusing on Italy [1], we show that extreme hourly rainfall events are becoming more frequent in summer and autumn in several regions, particularly in areas where convective storms [2] play a dominant role. This result would not have been possible using only observational data. No observational dataset exists that provides hourly rainfall measurements across all of Italy for a sufficiently long period—at least thirty years—needed to study trends. Instead, our work relies on a reanalysis, a reconstruction of past atmospheric conditions that combines available observations with numerical models based on the physical laws of the atmosphere through a process called data assimilation. The reanalysis used in this study is convection-permitting, meaning that it explicitly simulates convective processes, which are essential for accurately reproducing rainfall on short timescales.
Detecting hourly rain structures
To investigate these phenomena, we used a high-resolution meteorological reanalysis covering Italy over the years 1986-2022, namely MERIDA HRES [3]. Reanalyses combine observations with numerical weather models to reconstruct past atmospheric conditions in a physically consistent way. What makes these kinds of datasets special is their ability to explicitly represent atmospheric convection, the process responsible for thunderstorms and intense localised rainfall [4], which is parameterised in coarser datasets. From the hourly precipitation fields, we identified hundreds of thousands of individual rainfall systems each year, by applying a clustering technique based on percentile thresholds (Figure 1). Specifically, contiguous cells exceeding the 50th percentile of rainy days are considered a coherent precipitation structure. This resulted in a database of hourly rain events, which is openly available on Zenodo [5], and allowed us to analyse not only the frequency and intensity of rainfall events, but also their size, by enclosing each rain structure within an ellipse.
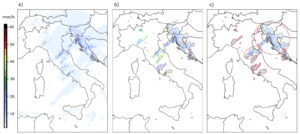
Figure 1: Example of event detection process for the day 20th October 2011, 13:00:00 UTC. a) raw precipitation field, b) after applying the threshold and the clustering (each border colour represents a different cluster), c) minimum enclosing ellipses used to identify the maximum spatial extent of the event.
How we identified extreme hourly rainfall
To focus specifically on the most intense events, we defined extreme hourly rainfall using a local and impact-relevant approach. . We used the average of the maximum hourly rainfall recorded in each year (Figure 2) as a threshold to select extreme events. In practical terms, this means that an event is considered extreme when the intensity of at least one of the points composing it exceeds what is typically observed during the strongest hourly rainfall record of a year at that location. This method allows us to account for regional differences in climate and ensures that the selected events are representative of locally hazardous conditions.
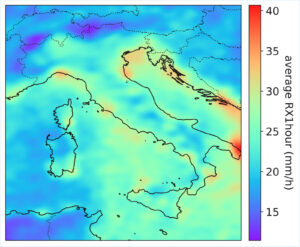
Figure 2: 1986-2022 average of the annual maxima of hourly precipitation.
By applying this criterion to the full event dataset we obtained, we were able to robustly track how the frequency of the most intense hourly rainfall events has changed over time across Italy.
Increasing extremes in specific regions and seasons
Focusing on the most extreme hourly events, we found statistically significant increases in their occurrence (Figures 3 and 4):
- In summer, the occurrence of extreme hourly rainfall has increased by about 20–30 % in several Alpine and Prealpine regions, as well as in parts of southern Italy.
- In autumn, the occurrence of extreme hourly rainfall increases up to 40% appear in coastal and maritime areas, including parts of the Ligurian coast, Sardinia, the southern Adriatic Sea, and the Ionian region.
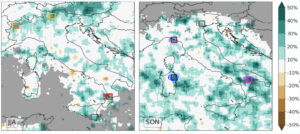
Figure 3: Maps of the significant decadal relative trends in the number of hourly precipitation extremes occurring within each 0.5° x 0.5° window (sliding step: 0.1°) for summer (JJA) and autumn (SON). Black dots indicate statistically significant trends (local significance at 0.05 level with Mann-Kendall test and False Discovery Rate correction). Areas with more than 10 years without extremes are masked in grey. The four colored boxes for each season highlight the regions used to extract the time series shown in Figure 4.
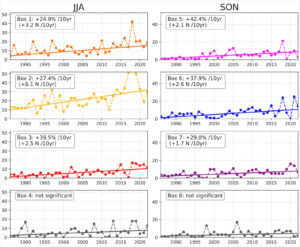
Figure 4: Time series of the seasonal number of occurrences of hourly precipitation extremes within the coloured windows in Figure 3. The left column shows the summer (JJA) series, while the right column displays the autumn (SON) series. Trend lines are plotted for each series, and the corresponding decadal trends are reported.
These patterns are consistent with regions where convective storms are a major driver of intense precipitation. They also align with independent studies based on rain gauge observations, which strengthens confidence in the results despite the known limitations of reanalysis data.
What this means for natural hazards
An increase in extreme hourly rainfall does not automatically translate into more disasters, but it raises the probability of high-impact events. Intense rainfall over a short period is often caused by convective storms, which are difficult to predict and can develop rapidly. As a result, the impact of such events is due not only to the vulnerability of the territory—such as urban areas with limited drainage or steep slopes prone to landslides—but also amplified by the challenge of preparing in advance for these sudden hazards. Infrastructure designed using historical rainfall statistics may no longer be adequate under current and future conditions, highlighting the need for updated risk assessments.
Our results underscore the importance of using high-resolution climate information when planning for flash floods and landslides. Convection-permitting reanalyses, such as MERIDA HRES, are particularly valuable because they fill spatial gaps where observational networks are too sparse, for example in rugged mountainous terrain where rain gauges are scarce. By providing a detailed, consistent view of short-duration precipitation extremes across the entire territory, these data allow scientists and planners to identify areas at risk that would otherwise be overlooked. By making territories more resilient and ready to respond to sudden, intense rainfall events, it is possible to reduce potential damage in a climate where extreme precipitation is becoming more frequent. Although our study focuses on Italy, the same approach can be applied anywhere reanalysis datasets are available, supporting better risk management in regions facing similar challenges.
Looking ahead
While uncertainties remain, particularly in reanalysis event positioning and long-term homogeneity, the emerging picture is clear: short-duration rainfall extremes are increasing in key seasons and regions. Accounting for these changes is essential for improving early warning systems, infrastructure design, and climate adaptation strategies. This study contributes to the broader discussion on how climate change is reshaping precipitation extremes and demonstrates how convection-permitting reanalyses can help us better understand and manage natural hazards linked to intense rainfall.
References
[1] Cavalleri, F., et al. (2026) Hourly precipitation patterns and extremization over Italy using convection-permitting reanalysis data, Natural Hazards and Earth System Sciences, 26, pp. 279–297. https://doi.org/10.5194/nhess-26-279-2026.
[2] Royal Meteorological Society (2020), What are convective storms? MetMatters, 10 June. Available at: https://www.rmets.org/metmatters/what-are-convective-storms (Accessed: 28/01/2026).
[3] Viterbo, F., et al. (2024), MERIDA HRES: A New High-Resolution Reanalysis Dataset for Italy, Meteorological Applications, 31(6), e70011. https://doi.org/10.1002/met.70011
[4] Cavalleri, F., et al. (2024), Multi-scale assessment of high-resolution reanalysis precipitation fields over Italy, Atmospheric Research, 312, 107734. https://doi.org/10.1016/j.atmosres.2024.107734
[5] Cavalleri, F. (2025), HOPSS-X (HOurly Precipitation Spatial Structures and Xtremes) from MERIDA HRES Reanalysis, Zenodo [data set], https://doi.org/10.5281/zenodo.15772543
Post edited by Hedieh Soltanpour and Navakanesh M Batmanathan