
Which type of natural hazard is the most frequent? And which one causes the largest economic losses? Which populations are mainly affected? What are the necessary steps to reduce natural hazards’ impact? If you have ever wondered about any of these questions, you’d be interested to know that there is an institute answering all of them with a series of reports and ad hoc publications.
We are talking about the Centre for Research on the Epidemiology of Disasters (CRED). The CRED is based, since 1973, at the Université Catholique de Louvain in Belgium and since 1980 it’s a collaborator of the World Health Organization (WHO). Their main goal? Study public health during a mass emergency as well as the structural and socio-economic impact of disasters caused by natural and technological hazards and human conflicts. They maintain the world’s most comprehensive database (EM-DAT) on occurrence and effects of technological and natural disasters from 1900 to the present day: more than 22,000 events and counting.
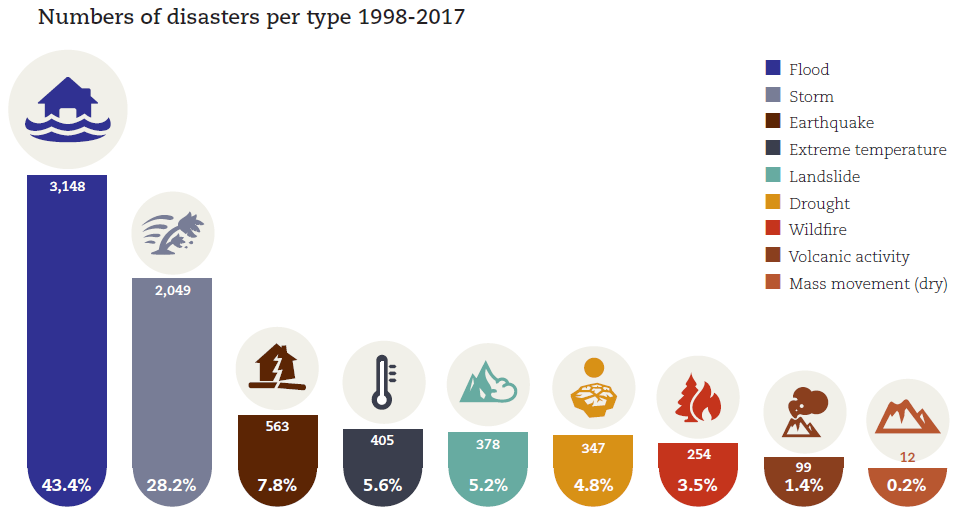
Fig. 2 Explanatory graphic from the CRED report ‘Economic Losses, Poverty & Disasters 1998-2017’ showing the number of natural disasters divided per type that happened during the twenty-year period accounted.
On their website, yearly reports, decennial statistics and on-topic publications are freely available and accessible for everyone. In 2018, they published the ‘Economic Losses, Poverty & Disasters 1998-2017’ document, which includes statistics about the trends in disasters associated with natural hazards of the twenty-year period 1998-2017. In that period, 91% of the 7,225 recorded disastrous events were climate-related. What do they mean with climate-related events? This large group includes hydrological (flood, landslide, wave action), meteorological (storm, extreme temperature, fog) and climatological (drought, glacial lake outburst, wildfire) events together. While under geophysical events, earthquake, dry mass movement and volcanic activity are included.
Flood events were the most frequent and the most impacting between 1998 and 2017.
Going to a single type of event (Fig. 2), we discover that flood events were the most frequent (43%), followed by storms (28.2%) and earthquakes (7.8%). The list continues with extreme temperature events, landslides, droughts, wildfires, volcanic activity and dry mass movements. The CRED’s report points out that compared to the previous twenty-year (1978-1997) the number of climate-related events doubled their yearly average. Even by taking into account the improvement in disaster reporting in the most recent years, the numbers are quite striking.
Going further in the report, we find that floods were not only the most occurring type of events, but they also affected the largest number of people: about 2 billion (45% of the total affected people). Droughts follow with 1.5 billion people affected, storms 726 million and earthquakes 125 million.
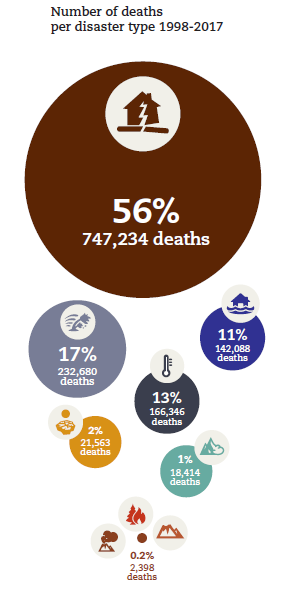
Fig. 3 Explanatory graphic from the CRED report ‘Economic Losses, Poverty & Disasters 1998-2017’ showing the deaths toll of natural disasters that happened during the twenty-year period accounted. See Fig.2 for the colour legend.
Earthquakes are deadliest events.
Earthquakes, however, do hold a different unfortunate record since they caused the most deaths: 747,234 (56% of the total, Fig. 4).
Deaths caused by earthquakes are, according to the report, exacerbated depending on the country and the community affected. Populations with a high rate of vulnerability, poor and with a low or very low level of preparedness and education on natural hazard are the most affected in the occurrence of a natural disaster. Comparing, for example, the 2010 Haiti’s earthquake with the New Zealand event in the same year and with similar magnitude (ca. 7), the latter affected 300,000 people but none of them were killed while the former killed 200,000 people and left more than 300,000 people injured. One difference was for sure the distance of the two hit towns from the epicentre of the earthquake, closer in the case of Haiti; however, the main difference was the actions taken by the New Zealand Government that led to stringent construction codes and a higher level of preparedness of the population, thus a general risk reduction.
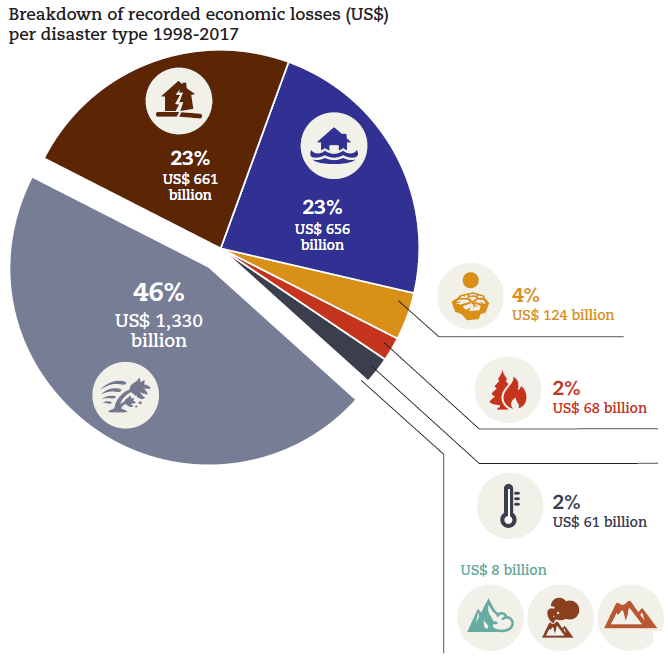
Fig. 4 Explanatory graphic from the CRED report ‘Economic Losses, Poverty & Disasters 1998-2017’ showing the economic losses of natural disasters that happened during the twenty-year period accounted. See Fig.2 for the colour legend.
Storms cause the largest economic losses.
Storms, including tropical cyclones and hurricanes, are second in the death toll, which accounted for 236,680 deaths (17%). At the same time, this type of events caused the largest economic losses amounting to US$1,300 billion, which are twice the economic losses reported for earthquakes and floods together (Fig. 4). The report concludes with some reflections on the fact that economic losses due to natural disasters affect more heavily poor and developing countries, hindering them from stepping forward and grow. Thus, they recommend actions to be taken also in the sense of reducing economic losses, where a good result has been already achieved in terms of reducing lives losses thanks to early warning systems and people education.
What for 2018?
A final remark on the yearly report for 2018, published last January: a total of 281 disasters were reported. With 108 floods, 84 storms, and 39 droughts events: climate-related extreme events continue to be the most numerous. The CRED reports a general negative trend in lives losses that keeps decreasing also in 2018, which, hopefully, means improvements in disaster management. However, they stress that seeing the constant rise of climate-related events and their higher reporting difficulties, the alert level should stay high.
References
CRED and UNISDR (2019), ‘2018 Review of Disaster Events’, CRED.
Centre for Research on the Epidemiology of Disasters – CRED (2018), ‘Cred Crunch 52 – Economic Losses, Poverty and Disasters: 1998-2017’, CRED.