The Geodynamics 101 series serves to showcase the diversity of research topics and methods in the geodynamics community in an understandable manner. We welcome all researchers – PhD students to Professors – to introduce their area of expertise in a lighthearted, entertaining manner and touch upon some of the outstanding questions and problems related to their fields. For our first ‘Geodynamics 101’ post for 2019, Assistant Prof. Jonny Wu from the University of Houston explains how to delve into the subduction record via seismic tomography and presents some fascinating 3D workflow images with which to test an identified oceanic slab.

Jonny Wu, U. Houston
Tomography… wait, isn’t that what happens in your CAT scan? Although the general public might associate tomography with medical imaging, Earth scientists are well aware that ‘seismic tomography’ has enabled us to peer deeper, and with more clarity, into the Earth’s interior (Fig. 1). What are some of the ways we can download and display tomography to inform our scientific discoveries? Why has seismic tomography been a valuable tool for plate reconstructions? And what are some new approaches for incorporating seismic tomography within plate tectonic models?
Figure 1: Tomographic transect across the East Asian mantle under the Eurasian-South China Sea margin, the Philippine Sea and the western Pacific from Wu and Suppe (2018). The displayed tomography is the MITP08 global P-wave model (Li et al., 2008).
Downloading and displaying seismic tomography
Seismic tomography is a technique for imaging the Earth’s interior in 3-D using seismic waves. For complete beginners, IRIS (Incorporated Research Institutions for Seismology) has an excellent introduction that compares seismic tomography to medical CT scans.
A dizzying number of new, high quality seismic tomographic models are being published every year. For example, the IRIS EMC-EarthModels catalogue currently contains 64 diverse tomographic models that cover most of the Earth, from global to regional scales. From my personal count, at least seven of these models have been added in the past half year – about one new model a month. Aside from the IRIS catalog, a plethora of other tomographic models are also publicly-available from journal data suppositories, personal webpages, or by an e-mail request to the author.
Downloading a tomographic model is just the first step. If one does not have access to custom workflows and scripts to display tomography, consider visiting an online tomography viewer. I have listed a few of these websites at the end of this blog post. Of these websites, a personal favourite of mine is the Hades Underworld Explorer built by Douwe van Hinsbergen and colleagues at Utrecht University, which uses a familiar Google Maps user interface. By simply dragging a left and right pin on the map, a user can display a global tomographic section in real time. The displayed tomographic section can be displayed in either a polar or Cartesian view and exported to a .svg file. Another tool I have found useful are tomographic ‘vote maps’, which provide indications of lower mantle slab imaging robustness by comparison of multiple tomographic models (Shephard et al., 2017). Vote maps can be downloaded from the original paper above or from the SubMachine website (Hosseini et al. (2018); see more in the website list below).
Using tomography for plate tectonic reconstructions
Tomography has played an increasing role in plate tectonic studies over the past decades. A major reason is because classical plate tectonic inputs (e.g. seafloor magnetic anomalies, palaeomagnetism, magmatism, geology) are independent from the seismological inputs for tomographic images. This means that tomography can be used to augment or test classic plate reconstructions in a relatively independent fashion. For example, classical plate tectonic models can be tested by searching tomography for slab-like anomalies below or near predicted subduction zone locations. These ‘conventional’ plate modelling workflows have challenges at convergent margins, however, when the geological record has been significantly destroyed from subduction. In these cases, the plate modeller is forced to describe details of past plate kinematics using an overly sparse geological record.
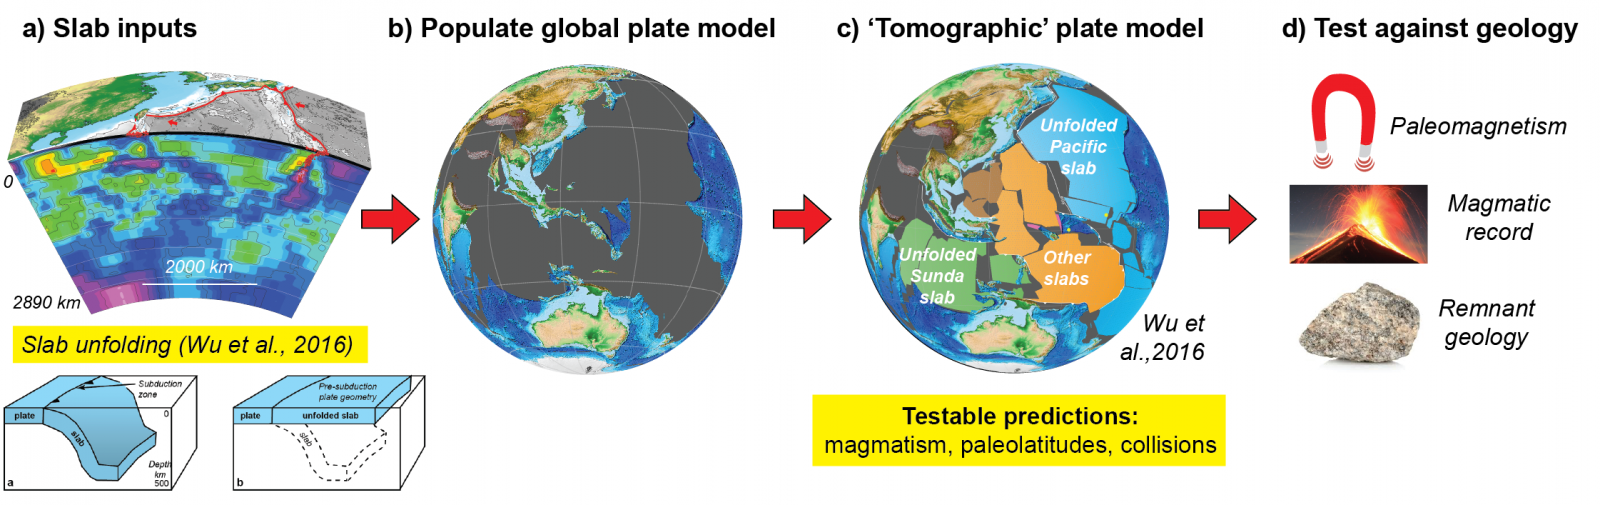
Figure 2: Tomographic plate modeling workflow proposed by Wu et al. (2016). The final plate model in c) is fully-kinematic and makes testable geological predictions for magmatic histories, terrane paleolatitudes and other geology (e.g. collisions) that can be compared against the remnant geology in d), which are relatively independent.
A ‘tomographic plate modelling’ workflow (Fig. 2) was proposed by Wu et al. (2016) that essentially reversed the conventional plate modelling workflow. In this method, slabs are mapped from tomography and unfolded (i.e. retro-deformed) (Fig. 2a). The unfolded slabs are then populated into a seafloor spreading-based global plate model. Plate motions are assigned in a hierarchical fashion depending on available kinematic constraints (Fig. 2b). The plate modelling will result in either a single unique plate reconstruction, or several families of possible plate models (Fig. 2c). The final plate models (Fig. 2c) are fully-kinematic and make testable geological predictions for magmatic histories, palaeolatitudes and other geological events (e.g. collisions). These predictions can then be systematically compared against remnant geology (Fig. 2d), which are independent from the tomographic inputs (Fig. 2a).
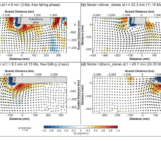
The proposed 3D slab mapping workflow of Wu et al. (2016) assumed that the most robust feature of tomographic slabs is likely the slab center. The slab mapping workflow involved manual picking of a mid-slab ‘curve’ along hundreds (and sometimes thousands!) of variably oriented 2D cross-sections using software GOCAD (Figs. 3a, b). A 3-D triangulated mid-slab surface is then constructed from the mid-slab curves (Fig. 3c). Inspired by 3D seismic interpretation techniques from petroleum geoscience, the tomographic velocities can be extracted along the mid-slab surface for further tectonic analysis (Fig. 3d).

Figure 3: Slab unfolding workflow proposed by Wu et al. (2016) shown for the subducted Ryukyu slab along the northern Philippine Sea plate. The displayed tomography in a), d) and e) is from the MITP08 global P-wave model (Li et al., 2008).
For relatively undeformed upper mantle slabs, a pre-subduction slab size and shape can be estimated by unfolding the mid-slab surface to a spherical Earth model, minimizing distortions and changes to surface area (Fig. 3e). Interestingly, the slab unfolding algorithm can also be applied to shoe design, where there is a need to flatten shoe materials to build cut patterns (Bennis et al., 1991). The three-dimensional slab mapping within GOCAD allows a self-consistent 3-D Earth model of the mapped slabs to be developed and maintained. This had advantages for East Asia (Wu et al., 2016), where many slabs have apparently subducted in close proximity to each other (Fig. 1).
Web resources for displaying tomography
Hades Underworld Explorer : http://www.atlas-of-the-underworld.org/hades-underworld-explorer/
Seismic Tomography Globe : http://dagik.org/misc/gst/user-guide/index.html
SubMachine : https://www.earth.ox.ac.uk/~smachine/cgi/index.php
References

Bennis, C., Vezien, J.-M., Iglesias, G., 1991. Piecewise surface flattening for non-distorted texture mapping. Proceedings of the 18th annual conference on Computer graphics and interactive techniques 25, 237-246.

Hosseini, K. , Matthews, K. J., Sigloch, K. , Shephard, G. E., Domeier, M. and Tsekhmistrenko, M., 2018. SubMachine: Web-Based tools for exploring seismic tomography and other models of Earth's deep interior. Geochemistry, Geophysics, Geosystems, 19.

Li, C., van der Hilst, R.D., Engdahl, E.R., Burdick, S., 2008. A new global model for P wave speed variations in Earth's mantle. Geochemistry, Geophysics, Geosystems 9, Q05018.

Shephard, G.E., Matthews, K.J., Hosseini, K., Domeier, M., 2017. On the consistency of seismically imaged lower mantle slabs. Scientific Reports 7, 10976.

Wu, J., Suppe, J., 2018. Proto-South China Sea Plate Tectonics Using Subducted Slab Constraints from Tomography. Journal of Earth Science 29, 1304-1318.

Wu, J., Suppe, J., Lu, R., Kanda, R., 2016. Philippine Sea and East Asian plate tectonics since 52 Ma constrained by new subducted slab reconstruction methods. Journal of Geophysical Research: Solid Earth 121, 4670-4741