 Dr. Laura Gulia is a senior post-doc at the University of Bologna, Department of Physics and Astronomy. She has a strong experience in statistical seismology, seismicity analysis as well as seismic hazard and risk assessment. Recently, she investigated the spatio-temporal evolution of the earthquake size distribution throughout a seismic sequence focusing on the b-value, a parameter characterizing the relationship between the earthquake magnitude and the number of earthquakes. She and her colleagues found out that, immediately after a mainshock, the b-value increases by 20%–30% and remains high for at least the following 5 years, reducing the chance of occurrence of a larger earthquake in the immediate vicinity of the fault that originated the mainshock. On the basis of their research, Laura and her colleague Prof. Stefan Wiemer, Director of the Swiss Seismological Service of ETH in Zurich, developed the Foreshock Traffic Light System, a promising tool for the mainshock and aftershock hazard assessment.
Hi Laura! Thank you for accepting this interview. Let’s go straight to the point: what is the Foreshock Traffic Light System and how does it work?
Hello everybody and thank you for inviting me! To answer your first question, a big earthquake is usually followed by many other events, whose magnitude and number decrease with time: they are called aftershocks. But also a bigger event can happen: so far, there was no way of predicting whether a powerful earthquake was likely to be followed by one of even greater magnitude. “Is it the mainshock?” is the most asked question by seismologists, public and decision-makers. The Foreshock Traffic Light System (FTLS) [1] is a statistical tool that can answer this question, establishing, in real-time, whether a big event will be followed or not by a bigger one. It is based on the spatio-temporal variation of the b-value. The b-value is a parameter used to define the Gutenberg–Richter law, which characterizes the relationship between the magnitude and number of earthquakes occurring in any given region and time period of at least that specific magnitude considered [2].
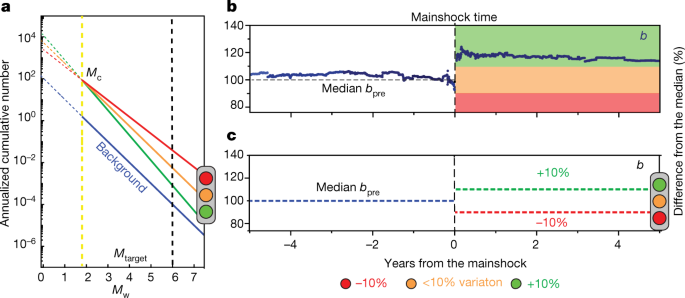
Figure 1. The foreshock traffic light system. Schematic representation of FTLS in the frequency–magnitude distribution view (a) and the b-value time-series view (c). Green denotes an aftershock sequence with a b-value increase of about 20%, where no mainshock is expected; yellow indicates that the b- value remains unchanged in the aftershock sequence or is difficult to determine; red means that the b-value decreases considerably and mitigation actions must be considered since a new energetic quake can occur. b) b-value stacking of 31 sequences, showing the percent difference with respect to the reference value, bpre (that is, the black horizontal dashed line which represents the median of the background b-values). The black vertical dashed line represents the time of the mainshock, shifted to zero [image from 1].
In seismic regions, the b-value is commonly close to 1 and, for long, most of the scientists considered it stable in time and space. However, in the last decades, different studies and laboratory measurements showed that the b-value space-time variability is inversely correlated to the state of stress in the Earth’s crust [3, 4]. From the analysis of 58 well-monitored seismic sequences from California, Japan, Italy and Alaska, we demonstrated in 2018 [5] that the b-value changes systematically during an earthquakes’ sequence and that it increases by about 20% after the biggest event of the sequence (in other words the mainshock).
Based on this observation, the FTLS indicates whether or not an even more powerful earthquake would follow in the ongoing seismic sequence. It turns to green if, after an event with magnitude (M) greater or equal than 6, the b-value increases by at least 10% and indicates that no other mainshock is expected. It turns red if the b-value drops 10% or more indicating that another energetic shock may occur and mitigations plans should be considered. Finally, it turns orange when the b-value rises or falls by less than 10%, which means that the scenario is still unclear (Fig. 1).
we reversed the usual point of view: instead of focusing on what happens before an earthquake, we analysed what happens after
When did you start studying the b-value?
It was 2004 when I first read the papers by Max Wyss, Stefan Wiemer and Danijel Schorlemmer about the b-value and its inverse correlation to the state of stress in the Earth crust [6, among others]. Soon I found the topic extremely interesting and it seemed so clear to me that the b-value was a key-parameter in seismology. A couple of years later, I spent one month at ETH in Zurich for my PhD and that has been the first step in the path that led to the intuition at the basis of the FTLS…
…what was this intuition?
The search for common patterns preceding an earthquake, the so-called precursors, is what scientists did so far. Well, we reversed the usual point of view: instead of focusing on what happens before an earthquake, we analysed what happens after… And this was the intuition! More simply, in the aftermath of an M>=6, we monitor the b-value: is it increasing, as we would expect after a mainshock? If not, that event was not the mainshock and a bigger event has yet to come; if yes, that event was the actual mainshock. I like to define it as prediction with hindsight!
How do you calculate a “reference b-value” for the background and why is this so important?
The reference b-value is a critically important value since the FTLS decisions are based on the difference in the percentage of the sequence-specific b-values in comparison with a reference value. To establish this value, we first build the fault plane of the event with M>=6; we then select all the earthquakes within 3km distance in the years preceding the M>=6 event. In a moving window approach, we calculated the b-value for the first 250 events and move event by event. The mean of all these single estimations is our reference b-value. A dense seismic network as well as several years of past data are essential for a successful implementation of the model.
Have you ever tested the Foreshock Traffic Light System in real-time during a seismic sequence?
The model has been submitted in February 2019 to Nature and, since that moment, never modified. During the revision process, in July 2019, an M6.4 hit Ridgecrest, California. We were all wondering: “was it the mainshock?”. We then tested our model pseudo-prospectively and the results were very promising: after the M6.4 event, the FTLS turned to red, indicating that a stronger earthquake was still probable to hit Ridgecrest and, just after a couple of days, an M7.1 hit a few km from the M6.4 epicentre! After this second event, the FTLS gave green light and, until today (15 months after) there has not been any bigger event. Further, by mapping the b-value variation, we could also locate where the M7.1, the actual mainshock, was expected to nucleate [7] (Fig. 2).
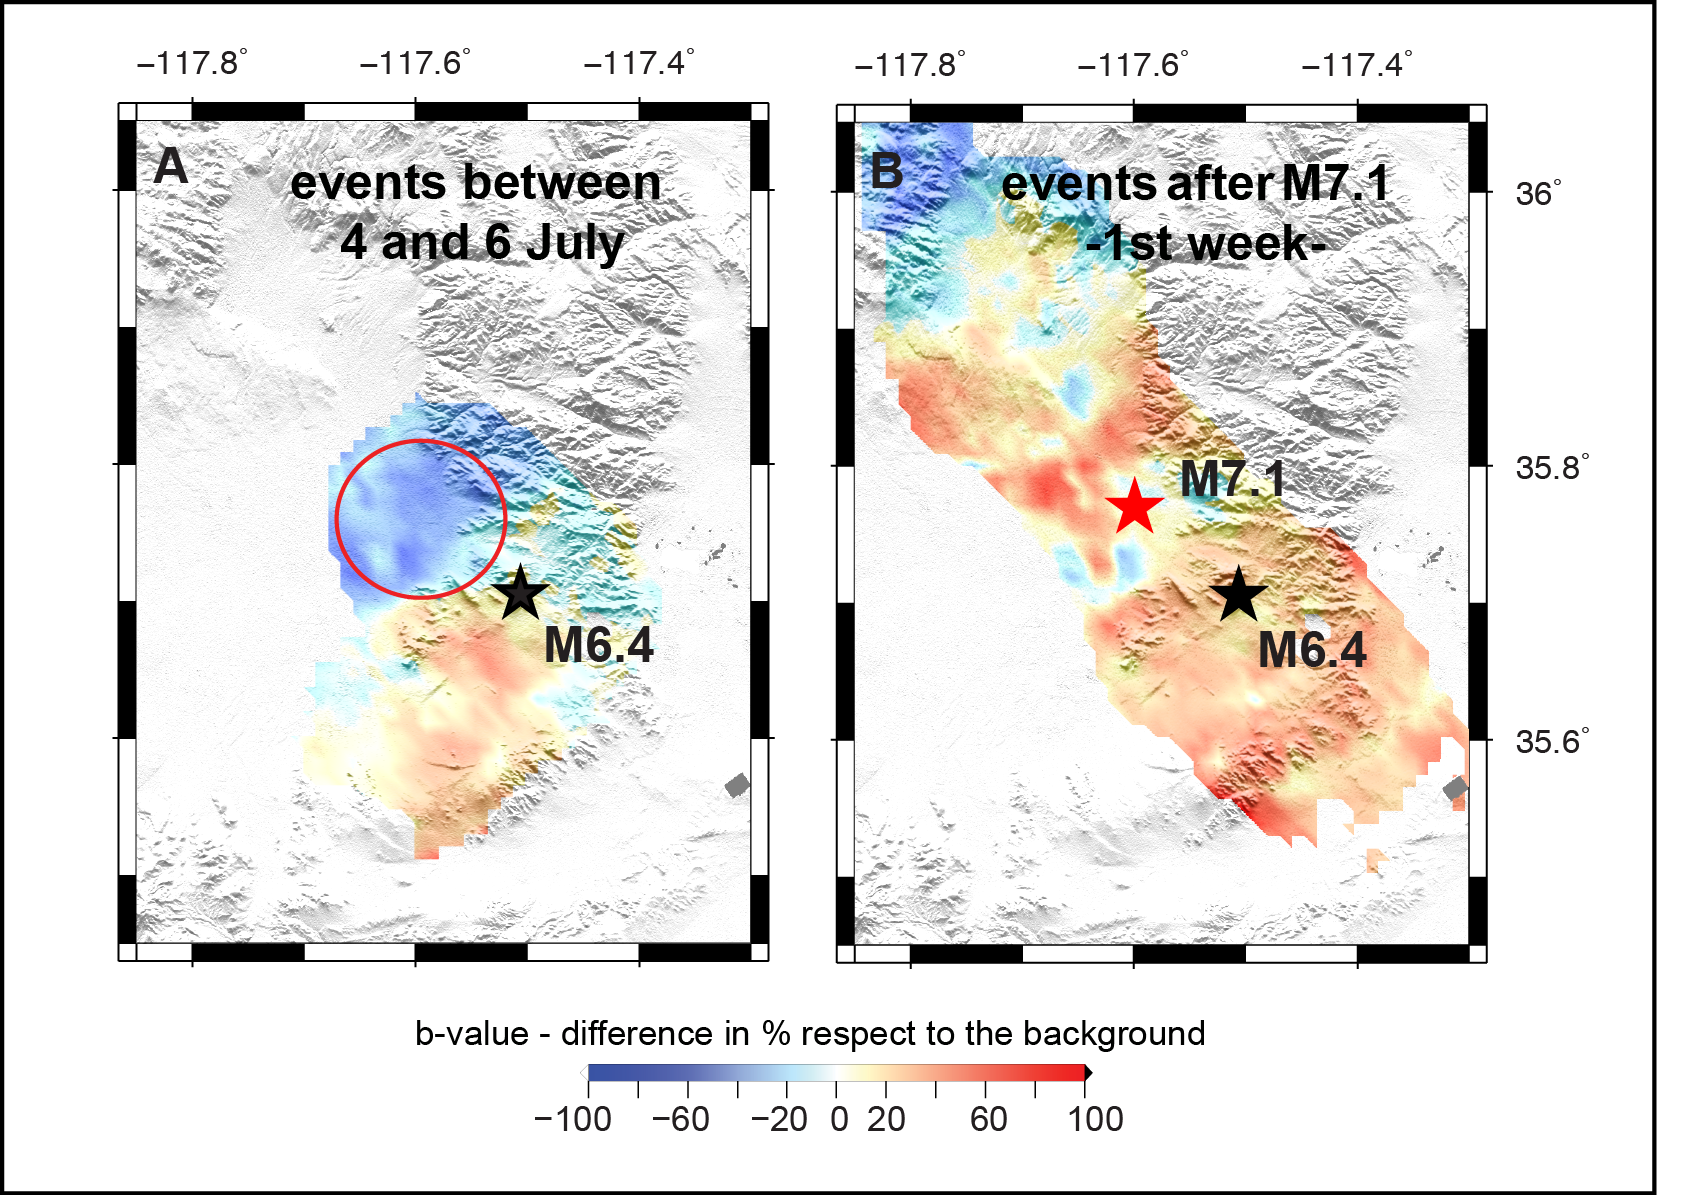
Figure 2. Mapped b-values with the difference in percentage with respect to the background for two different periods: (a) between Mw 6.4 and Mw 7.1; (b) the first week after Mw 7.1. Black star: M6.4 epicentre; red star: M 7.1 epicentre [image from 7].
The FTLS can be implemented only after an M6 and above and, at present, just in few and small regions, because it requires a dense seismic network as well as years of records of past earthquakes. It is a new tool and it is too early to use it routinely for making decisions, for example, by civil protection. The model needs to be further tested and we are currently working on a real-time tool for the Collaboratory for the Study of Earthquake Predictability [8], financed by the European Real-time earthquake risk reduction.
hypotheses proposed by a group need to be evaluated independently by others. Only with an open, rigorous and fair discussion, Science can make progress
Is it possible to freely access the code of your model?
We supplied the source code of the model openly because we believe that Science needs to work so: hypotheses proposed by a group need to be evaluated independently by others. Only with an open, rigorous and fair discussion, Science can make progress.
The datasets generated and analysed during the current study, as well as the Matlab codes written for the analysis, are available here.
References
[1] Gulia, L., and S. Wiemer (2019). Real-time discrimination of earthquake foreshocks and aftershocks, Nature 574, 193–199. https://doi.org/10.1038/s41586-019-1606-4
[2] Gutenberg, B., & Richter, C. F. (1956). Magnitude and energy of earthquakes: Annali di Geofisica. Annali di Geofisica, 9(1), 7-12.
[3] Scholz, C. H. (1968). The frequency-magnitude relation of microfracturing in rock and its relation to earthquakes. Bulletin of the Seismological Society of America, 58, 399–415.
[4] Goebel, T. H. W., Schorlemmer, D., Becker, T. W., Dresen, G., & Sammis, C. G. (2013). Acoustic emissions document stress changes over many seismic cycles in stick-slip experiments. Geophysical Research Letters, 40, 2049–2054. https://doi.org/10.1002/grl.50507
[5] Gulia, L., Rinaldi, A. P., Tormann, T., Vannucci, G., Enescu, B., & Wiemer, S. (2018). The effect of a mainshock on the size distribution of the aftershocks. Geophysical Research Letters, 45. https://doi.org/10.1029/2018GL080619
[6] Schorlemmer, D., Wiemer, S., & Wyss, M. (2005). Variations in earthquake-size distribution across different stress regimes. Nature, 437(7058), 539–542. https://doi.org/10.1038/nature04094
[7] Gulia, L., S. Wiemer, and G. Vannucci (2020). Pseudoprospective Evaluation of the Foreshock Traffic-Light System in Ridgecrest and Implications for Aftershock Hazard Assessment, Seismol. Res. Lett. 91(5), 2828–2842. https://doi.org/10.1785/0220190307.
[8] Schorlemmer D., M.J. Werner, W. Marzocchi, T. H. Jordan, Y. Ogata, D. D. Jackson, S. Mak, D. A. Rhoades, M. C. Gerstenberger, N. Hirata, M. Liukis, P. J. Maechling, A. Strader, M. Taroni, S. Wiemer, J. D. Zechar, J.Zhuang (2018), The Collaboratory for the Study of Earthquake Predictability: Achievements and Priorities. Seismological Research Letters 89 (4): 1305–1313. https://doi.org/10.1785/0220180053