Underground energy storage and gas storage in aquifers
In the context of energy transition, massive energy storage is a key issue for the integration of renewable sources into the energy mix. Storing energy in the underground can lead to larger-scale, longer-term and safer solutions than above-ground energy storage technologies. In particular, natural gas storages are designed to address different needs, like a strategic natural gas reserve, the regulation of gas supply and the answer to a seasonal peak heating or electricity demand. Energy companies routinely store gas in underground reservoirs known as “gas aquifers”, which then become gigantic natural tanks for injecting and extracting gases for energy needs. The natural gas is compressed and injected through wells into selected reservoirs, usually constituted of sand layers containing water, which is automatically forced out. The gas is then extracted from the same wells and the water can naturally flow back into the sand, maintaining equilibrium. Natural gas is stored from May to September when the demand is lower and withdrawn from October to April when the demand is higher.
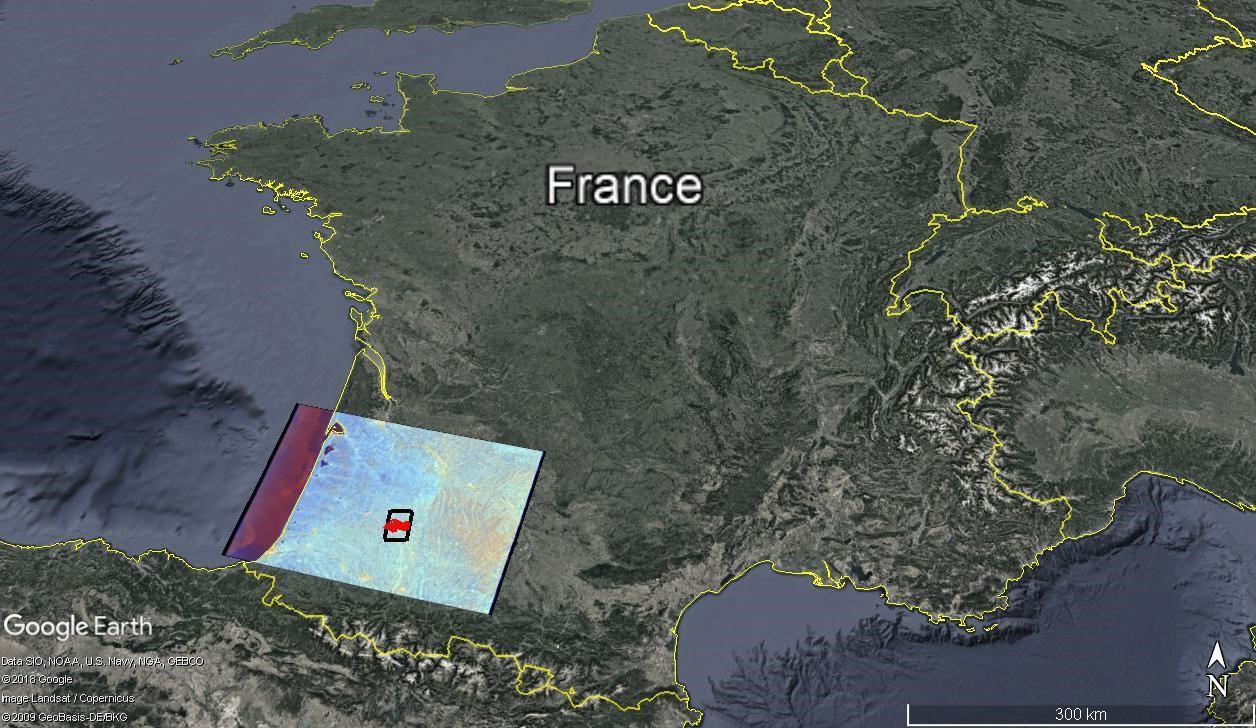
Figure 1 – Location map showing a Sentinel-1 acquisition (2016) in Southwestern France (Aquitaine Basin) (colour image), a 25 km cell used by SMOS satellite (black square) that contains the reservoir isobaths of a gas storage site (red lines).
Integrated monitoring of a gas storage site
For risk prevention and environmental protection purposes, it is essential to check the integrity of the natural reservoirs used for underground storage and how they respond to the annual natural gas injection and extraction cycles. Surveillance is also essential to avoid leaks, which would cause losses for the operator, but especially to prevent any degradation of the storage conditions that could raise risks to health or the environment. Integrated monitoring should include a network of microseismic sensors, observation wells to control the reservoir and overburden pressures, as well as a technique to measure ground surface displacements over wide areas.
Standard ground surface monitoring techniques provide information on a very limited number of points within an area, both in the cases of geotechnical monitoring (clinometers, extensometers…) or GPS. The idea of a ground displacement monitoring using Differential Synthetic Aperture Radar interferometry (DInSAR) has been intensively developed in the last two decades. Land subsidence or uplift related to groundwater extraction or recharge of aquifers of large cities are some applications of the DInSAR remote sensing technique[1,2]. Conversely, the monitoring of gas storage using the DInSAR techniques has received until now few attentions from the scientific community[3,4]. A major limiting factor to this purpose was the non-availability of both spatially and temporally high-resolution Synthetic Aperture Radar (SAR) dataset. Moreover, DInSAR techniques are generally more performant on regular motions than on displacements with non-linear behaviour respect to time (i.e. with strongly varying rates), because they require finer temporal sampling to be characterized[5]. Another limiting factor is the low amplitude of deformation associated with gas storage in deep geological layers, which is typically a few millimetres, i.e. equivalent of the DInSAR precision[4]. The launch by the European Space Agency (ESA) of the Sentinel-1 mission in 2014 represented a new step and the offer of continuous data provision, with a 6-day exact repeat cycle at the equator (Figure 1).
Improving the shrink/swell hazard at the national scale using space-borne remote sensing
Due to the potential substantial damage to buildings and infrastructure, the mapping of expansive soils and the quantification of the clay swelling potential is a major concern for natural risk prevention plans. In France, the shrink/swell risk is one of the most important causes of financial compensation from insurance companies behind the flood risk as evaluated by the CCR (French public-sector reinsurer).
In 2010, based on the spatial distribution of infrastructure damage and the stratigraphy at the resolution of sedimentary basins, the French Geological Survey (BRGM) published a predictive 1:50 000 swelling-risk map of France. This map indexed the territory as (i) no, (ii) low/weak, (iii) moderate/medium, or (iv) high/strong risk. For example, in the studied area in the Aquitaine Basin (Figure 1), there is only a low to moderate swelling risk. At this resolution (1:50 000), the sand layer (Serravallian stage) is characterized by a low hazard and the clay layer (Tortonian stage) by a moderate hazard but the heterogeneity of the mineralogical composition of these two sedimentary formations is not considered. Therefore, it is not excluded to observe some clay lenses within the “Serravallian” or clay minerals with little swelling potential within the “Tortonian”.
The traditional way to improve this map consists of monitoring soil moisture variations and ground movements with the instrumentation of experimental sites. BRGM has studied three sites with different climate conditions: 1) the Mormoiron site with a Mediterranean climate[6], 2) the Le Deffend site[6] with an oceanic climate sheltered from continental influence and 3) the Chaingy site with a semi-oceanic climate (slightly continental). On each site, capacitive sensors have been installed inside boreholes at different depths to track soil moisture variations continuously. In situ extensometers have also been deployed to monitor soil vertical displacements (Figure 2). For two years from September 2016, the two extensometers at Chaingy have shown that the swelling and settlement ground movements of the surface can reach 10 millimetres in only 6 months. The same order of magnitude of soil expansion was observed at Mormoiron site and twice more on the Le Deffend site. The most interesting result is the strong spatial and temporal variability of the ground motion process observed at Chaingy.
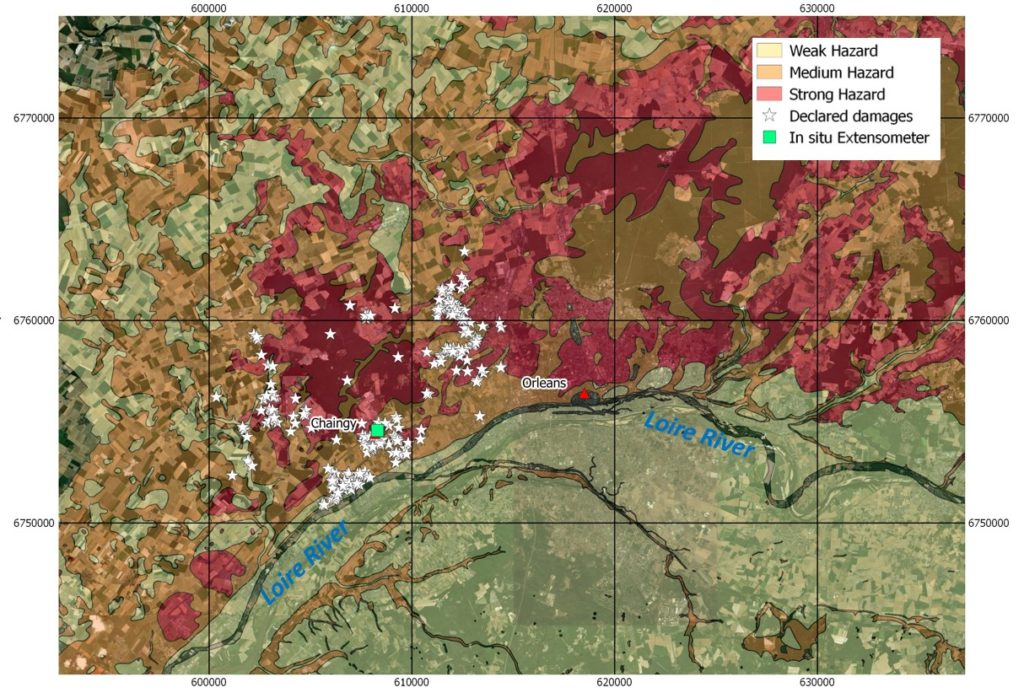
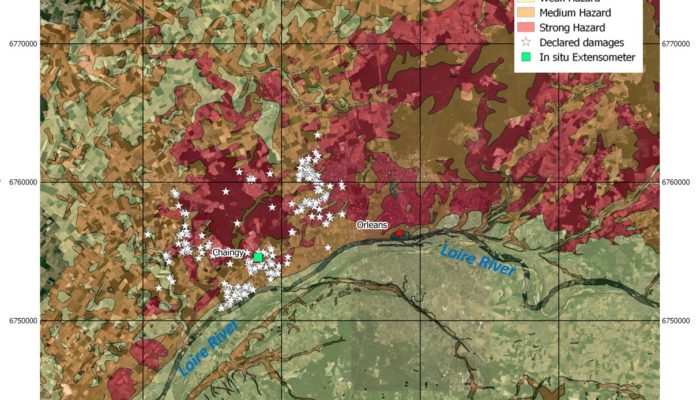
Figure 2 – Location map of the Chaingy instrumental site using extensometers (green square) near Orléans showing some declared building damages (white stars) and three shrink/swell hazard domains (weak in yellow, medium in orange and strong in red) based on the 1: 50 000 geological map (http://infoterre.brgm.fr/). Map created using QGIS (http://qgis.org)
Another way to improve the swelling-risk map is to use space-borne remote sensing satellite techniques (i.e. DInSAR) based on both spatially and temporally high-resolution and high-quality images that are now available thanks to the above-mentioned launch of the Sentinel-1 mission.
Ground displacement using DInSAR and comparison with a simple mechanical model
Within the CITEPH project Web-RDS (link to the project summary), we performed the first 3-years long integrated monitoring of a gas storage site in the Aquitaine Basin (Southwestern France)[7], where a low or moderate swelling risk is reported on the National map. Acquisitions of the Sentinel-1 satellite were processed by TRE-ALTAMIRA company with the SqueeSAR® technique providing 1931 measurement points over the area of interest and comprehensively analyzed by BRGM to investigate the ground displacement around gas exploitation and monitoring wells (Figure 3).
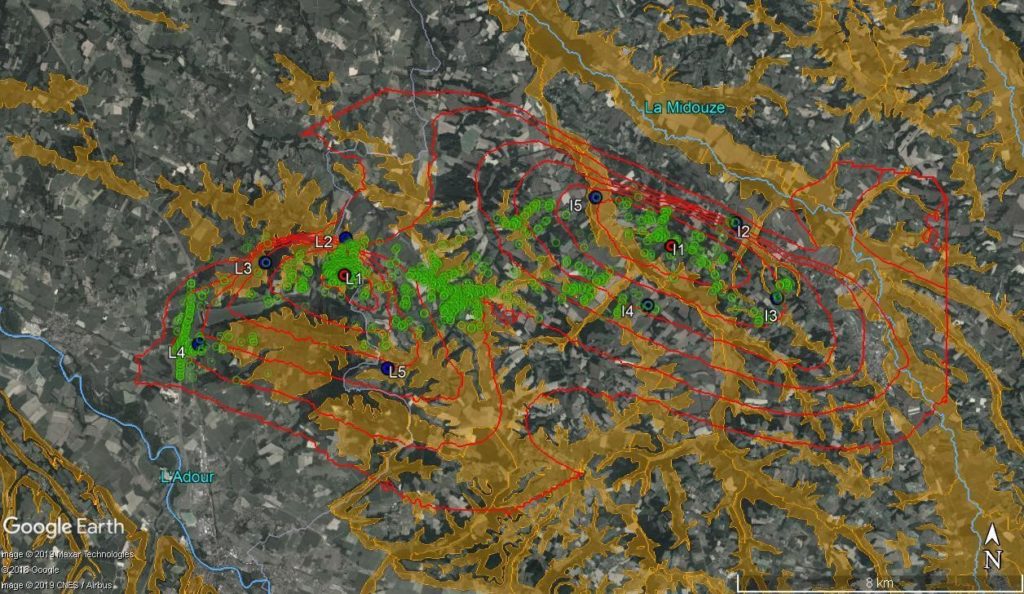
Figure 3 – The double gas storage site with the reservoir isobaths (red), the gas exploitation wells L1, I1 (red circles), the monitoring wells L2-5, I2-5 (blue circles) and the scatterers using the SqueeSAR® method (green circles). Also shown is the medium shrink/swell hazard domain (orange).
Despite the quite low Line-Of-Sight (LOS) displacement measured by the DInSAR (about 6 mm) compared to the noise level (about 3 mm), the annual cyclic motion reflects quite well the seasonal variations due to charge and discharge during summer and winter periods, respectively (Figure 4).
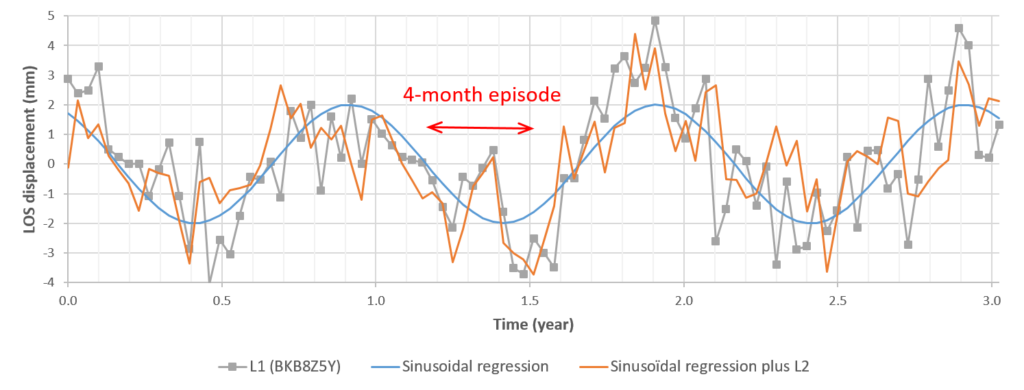
Figure 4 – Time evolution of LOS displacement around L1 gas exploitation well (BKKB8Z5Y). Also shown are the sinusoidal regression model and the model using the wavelet-based analysis during the 4-month episode (see text).
A simplified mechanical model can explain the magnitude of these vertical and horizontal displacements at both storage sites around L1 and I1 gas exploitation wells locations (Figure 5). Because the noise level is about 3 mm, we can neglect the contribution of horizontal displacement around L1 and I1 wells and transform the displacement from LOS to the vertical.
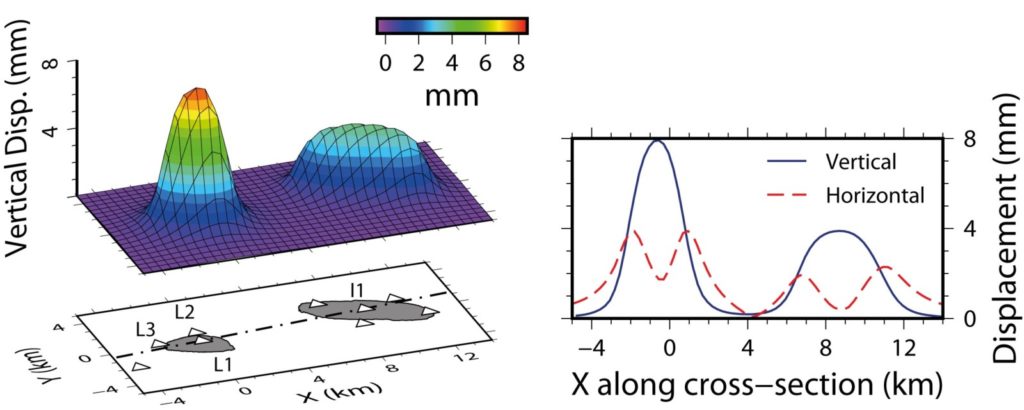
Figure 5 –On the left-hand side, the absolute value of the predicted vertical ground displacement (millimetre) during each injection/production simultaneous cycle at both storage sites. Also shown are the locations of the exploitation wells L1 and I1, the monitoring wells L2 and L3. On the right-hand side, the cross-section along L1 and I1 gives the absolute value of the predicted vertical and horizontal displacements (GMT 5.1.2, http://gmt.soest.hawaii.edu).
Cross wavelet transform of Line-Of-Sight (LOS) displacement acquired by Sentinel-1A and Surface Soil Moisture (SSM) acquired by SMOS.
Despite a general consistency, some features around the L1 gas exploitation well (Figure 4) cannot be explained by the seasonal variations and were further investigated.
The continuous wavelet transform (CWT), a mathematical tool, is especially suited to extract features from low signal-to-noise ratio time-series like the ones described here. CWT expands time-series records into time/frequency space and can identify localized intermittent periodicities. Additionally, two individual CWTs can be combined by using the cross wavelet transform (XWT) tool. The absolute value of the XWT will be high in the time-frequency areas where both CWTs display high values, helping to identify common time patterns in the two data sets. The proposed methodology here is to use XWT to analyze comprehensively the DInSAR time-series vs. potential triggering factors time series like the soil moisture.
The 10-day SMOS surface soil moisture (SSM) products in the grid cell of the studied zone (Figure 1) are used to calculate the average SSM value for each Sentinel-1 period (12 days).
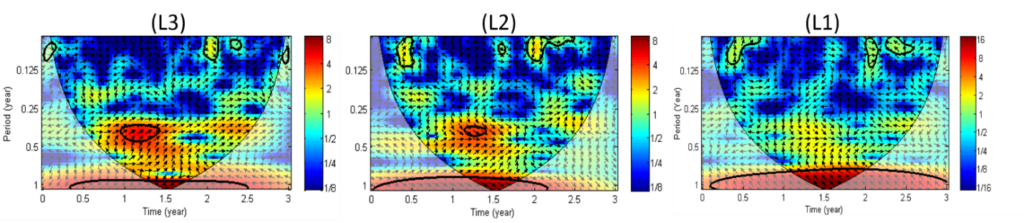
Figure 6 – Cross wavelet transform (XWT) of the Surface Soil Moisture and the LOS displacement at L3/L2 (monitoring wells) and at L1 gas exploitation well. The thick contour designates the 5 % significant level against red noise. The cone of influence (COI) where edge effects might distort the picture is shown as a lighter shadow. The MATLAB wavelet toolbox is provided by A. Grinsted (http://www.glaciology.net/wavelet-coherence).
In the time/frequency space, there is a thick contour with a 4-month period during a short time episode at both locations L3 and L2 (Figure 6). The phase of the XWT indicates the time lag between the two time-series. The relative phase relationship is shown as arrows, with in-phase pointing right and anti-phase pointing left. At L3 location, both time series are quite in-phase (arrows pointing right) and at L2 location, the SSM time series is leading by about one month (arrows pointing down) (Figure 6). At L1 location, there is a cyclic displacement during a short time episode of year 2 (a 4-month period in yellow with arrows pointing down) that contrasts with the annual deformation due to the gas exploitation (thick contour with a one-year period).
A possible explanation is that the observed cyclic LOS displacement during the short episode is due to the clay swelling and that the time lag is due to the infiltration time of water in the unsaturated zone from the surface to the clay layer. Using the available geological logs from the BRGM subsurface database (BSS), we find indeed a clay layer at the surface at L3 and at 3 m of depth at both L2 and L1 (Figure 7).
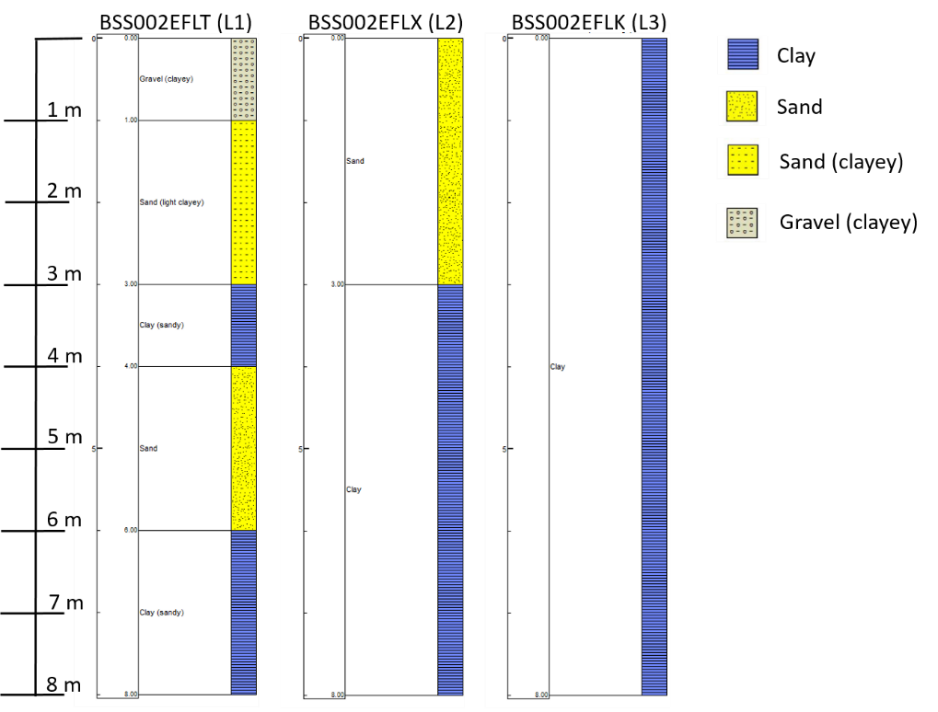
Figure 7 – Geological Logs extracted from the BSS subsurface database (“Banque de données du sous-sol”, http://infoterre.brgm.fr/) in the vicinity of L1 gas exploitation well and L2-L3 monitoring wells.
We then simulated the LOS displacement near L1 supposing that the displacement due to the clay swelling is the same at L1 and L2 (because of the same depth of the clay layer). This model fits indeed quite well the LOS displacement at L1 during the 4-month episode (Figure 4).
In this specific case, the wavelet-base method using space-borne remote sensing (Sentinel-1 and SMOS) was able to unravel both the different processes driving the ground displacement of the same order of magnitude, namely the pressure variation of a deep reservoir and the swelling/shrinking of the shallow subsurface.
Conclusion and perspectives
The question “Can we map swelling clays with remote sensing?” asked by Van der Meer in 1999 is still a topical issue. Twenty years later, our answer is yes using a wavelet-based analysis in a limited area in Southwestern France. As a perspective of this work[7], the same method coupling both satellite acquisitions (Sentinel-1 and SMOS) can be first validated against ground-based measurements (e.g. at the Chaingy site, Figure 2) and then generalized using a global SAR dataset and the BSS database to improve the French shrink/swell hazard map.
REFERENCES
- Declercq, P. et al. A Study of Ground Movements in Brussels (Belgium) Monitored by Persistent Scatterer Interferometry over a 25-Year Period. Geosciences 7, 115 (2017). 10.3390/geosciences7040115
- Bonì, R. et al. A methodology to detect and characterize uplift phenomena in urban areas using Sentinel-1. data. Remote Sensing 10, 607 (2018). 10.3390/rs10040607
- Teatini, P. et al. Geomechanical response to seasonal gas storage in depleted reservoirs: A case study in the Po River basin, Italy. J. Geophys. Res. 116 (2011). 10.1029/2010JF001793
- Rohmer, J. & Raucoules, D. On the applicability of Persistent Scatterers Interferometry (PSI) analysis for long term CO2 storage monitoring. Engineering Geology 147–148, 137–148 (2012). 10.1016/j.enggeo.2012.07.010
- Raucoules, D. et al. Validation and intercomparison of Persistent Scatterers Interferometry: PSIC4 project results. J. Appl. Geophys. 68, 335-347 (2009). 10.1016/j.jappgeo.2009.02.003
- Vincent, M., Le Roy, S., Dubus, I. & Surdyk, N. Experimental monitoring of water content and vertical displacements in clayey soils exposed to shrinking and swelling. Revue Française de Géotechnique, 45–58 (2007). 10.1051/geotech/2007120045
- Burnol, A. et al. Wavelet-based analysis of ground deformation coupling satellite acquisitions (Sentinel-1, SMOS) and data from shallow and deep wells in Southwestern France. Scientific Reports 9, 8812 (2019). 10.1038/s41598-019-45302-z
About the Authors:
André Burnol is head of Safety and Performance of underground Uses (SPU) unit of the Risks and Prevention Division (DRP) at the Bureau de Recherches Géologiques et Minières (BRGM, French Geological Survey). He has a PhD in Environmental Geochemistry from the Grenoble University, France. He has worked on modelling the coupling of physical and (bio)geochemical processes controlling the mass transfer between water, gas and solid phases in porous media. His current research topic concerns the safety and performance of gas storage in the sub-surface (e.g. CO2 storage, energy storage).
Daniel Raucoules received the PhD degree from the University Montpellier II, Montpellier, France in 1997. He is a researcher in the DRP Division of BRGM in the domain of space-borne remote sensing tools (mainly radar interferometry and image correlation) applied to the measurement of ground surface deformation since 1999. His research interests include methodological developments and their application to thematics dealing with ground motion, seismotectonic deformation, fluid injection/extraction and post-mining. He received in 2011the “Habilitation à Diriger des Recherches” (HDR) from the University of Orléans, France.
Hideo Aochi is a researcher in seismology at the DRP Division of BRGM. He got a PhD in Geophysics at the University of Tokyo, Japan. He has been working on the mechanics of earthquake and any related deformation process. His current research topic concerns the mechanical and statistical modelling of the induced seismicity for subsurface usage safety.
Sébastien Gourdier is head of the Mass movement and Soil Erosion Risk (RIG) unit at the DRP Division of BRGM. He obtained a diploma of Ingénieur Civil des Mines (Master of Science) at Nancy School of Mines, France. He worked as a Geotechnics Engineer at BRGM since 2010.
post edited by: Gabriele Amato and Valeria Cigala