At the geodynamic scale, tectonic forces guide the distribution of stress. Stress in the Earth is not constant, but varies through space. Variations in gravitational energy caused by changes in mass distribution within the Earth, forces acting at plate boundaries, and basal mantle drag all cause stress to vary and act in different directions. Overall, stress plays a key role in tectonics. It allows plates to deform, faults to slip, and earthquakes to occur. It can trigger or delay future earthquakes and is also important in engineering applications. Yet it remains one of the hardest properties of the Earth to measure. Interestingly, most measurements of stress are actually based on measurements of strain, that is, the interpretation of deformation (Becker and Faccenna, 2025). So how stress is measured in the crust?
- Stress from borehole data: Boreholes drilled during scientific drilling projects, oil and gas exploration, or geothermal energy production are among the most important ways to measure stress directly. These methods include:
- Hydraulic fracturing, where fluid is pumped into the rock to increase pressure until the rock fractures. The pressure required to open the fracture is used to calculate the minimum horizontal stress, while the orientation of the fracture indicates the direction of the stress field.
- Imaging logs, which detect borehole breakouts formed in the borehole wall during drilling. These breakouts indicate the direction of maximum horizontal stress. Imaging logs can also detect tensile fractures, which are cracks formed where the stress is lowest.
The main limitation of borehole data is that it is sparse, and interpreting it across larger regions requires well-calibrated geological models to interpolate the data where measurements are not available.
- Earthquake focal mechanisms: earthquakes indicate the orientation of stresses acting on faults. Seismologists determine focal mechanisms from earthquakes, which show the orientations of compression and extension. By combining multiple focal mechanisms, it is possible to reconstruct the regional stress field.
- Seismic anisotropy: seismic wave speeds can depend on their propagation direction (an effect called anisotropy). In the crust, this anisotropy can partly result from the alignment of cracks, which themselves reflect crustal stress.
- Paleostress indicators: evidence of past stress fields can be traced from fault slip directions, striations on fault planes, fractures, and folds.
-
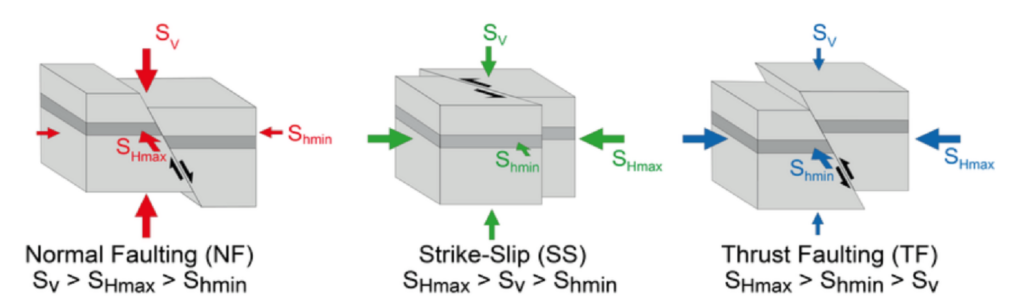
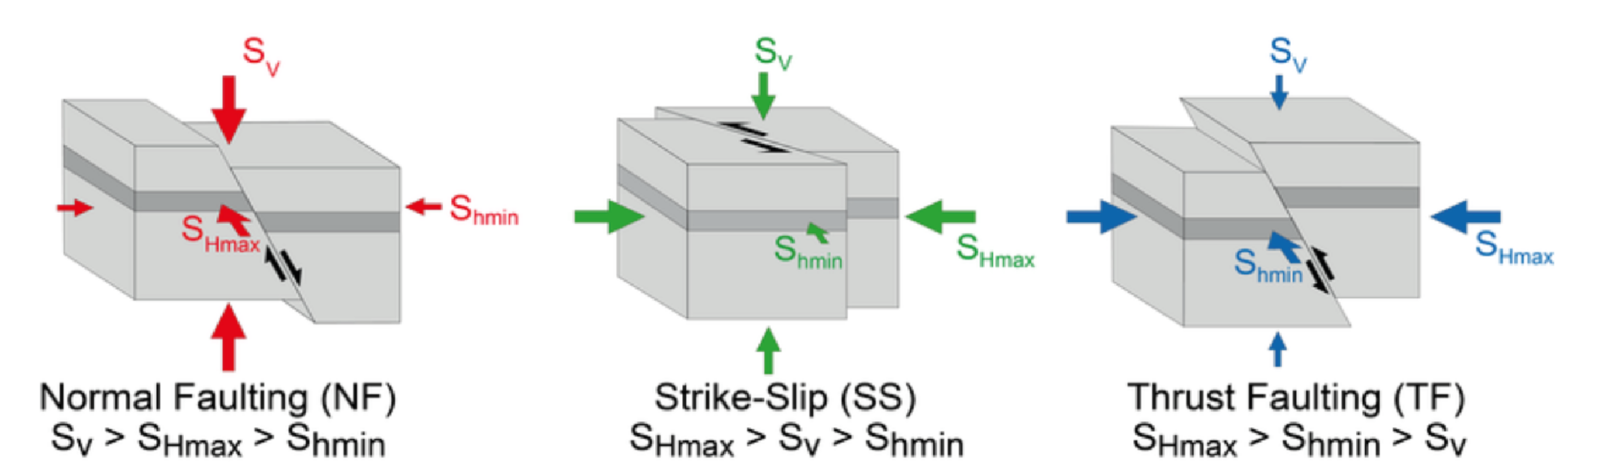
Fig 1: diagrams showing stress orientations for the three different types of faulting: normal, strike slip and reverse. Shmax is the maximum horizontal stress, SHmin, the minimum horizontal stress and Sv the vertical stress Credit: World Stress Map Team, 2016 (CC BY 4.0)
A community effort to compile present-day crustal stress
The World Stress Map (WSM) project (Zoback, 1992; Heidbach et al., 2018) is a collaborative effort that compiles global information on present-day crustal stress. Most of the constraints in the WSM rely on focal mechanisms, which means that the database provides more information in seismically active regions. Data from the WSP is used across a wide range of disciplines including geodynamics, hazard assessment, reservoir geomechanics, and geotechnical applications.

Fig 2: World stress map showing the orientation of maximum horizontal stress SHmax (Heidebach et al. 2025)
References

Becker, T., Faccenna, F (2025) Tectonic Geodynamics. Princeton University Press

Heidbach, O., Rajabi, M., Di Giacomo, D., Harris, J., Lammers, S., Morawietz, S., Pierdominici, S., Reiter, K., Storchak, D., von Specht, S., Ziegler, M. O. (2025): World Stress Map 2025, GFZ Data Services, doi:10.5880/WSM.2025.002

Heidbach, O., Rajabi, M., Cui, X., Fuchs, K., Müller, B., Reinecker, J., Reiter, K., Tingay, M., Wenzel, F., Xie, F. and Ziegler, M.O., (2018). The World Stress Map database release 2016: Crustal stress pattern across scales. Tectonophysics, 744, pp.484-498.

Zoback, M. L. (1992). First‐and second‐order patterns of stress in the lithosphere: The World Stress Map Project. Journal of Geophysical Research: Solid Earth, 97(B8), 11703-11728