The central Mediterranean is a geodynamically complex region shaped by the interaction of multiple active subduction zones. In Italy, the central Apennines display a distinctive pattern of surface deformation that is proposed to be linked to a slab break-off beneath the area. In this week’s blog post, Maaike, a PhD student at ISTerre in Grenoble, France, explores the key processes driving surface deformation and seismicity in the central Apennines.
The central Apennines: slab detached or attached?
The Adria microplate plays a key in the central Mediterranean geodynamic. The plate is subducting at its eastern margin in the Dinarides, and at its western margin in the Apennines, forming an outward dipping double subduction zone (Figure 1). The Apennines slab ranges from the northern Apennines all the way to the Calabrian arc in the south. At depths below 250 km the slab appears continuous, but at shallower depth a high velocity anomaly underneath the central Apennines has been detected in various tomographic models (e.g. Piromallo & Mirelli, 2003, Rappisi et al., 2022). This has been interpreted as either a slab gap, slab tear or slab damage.
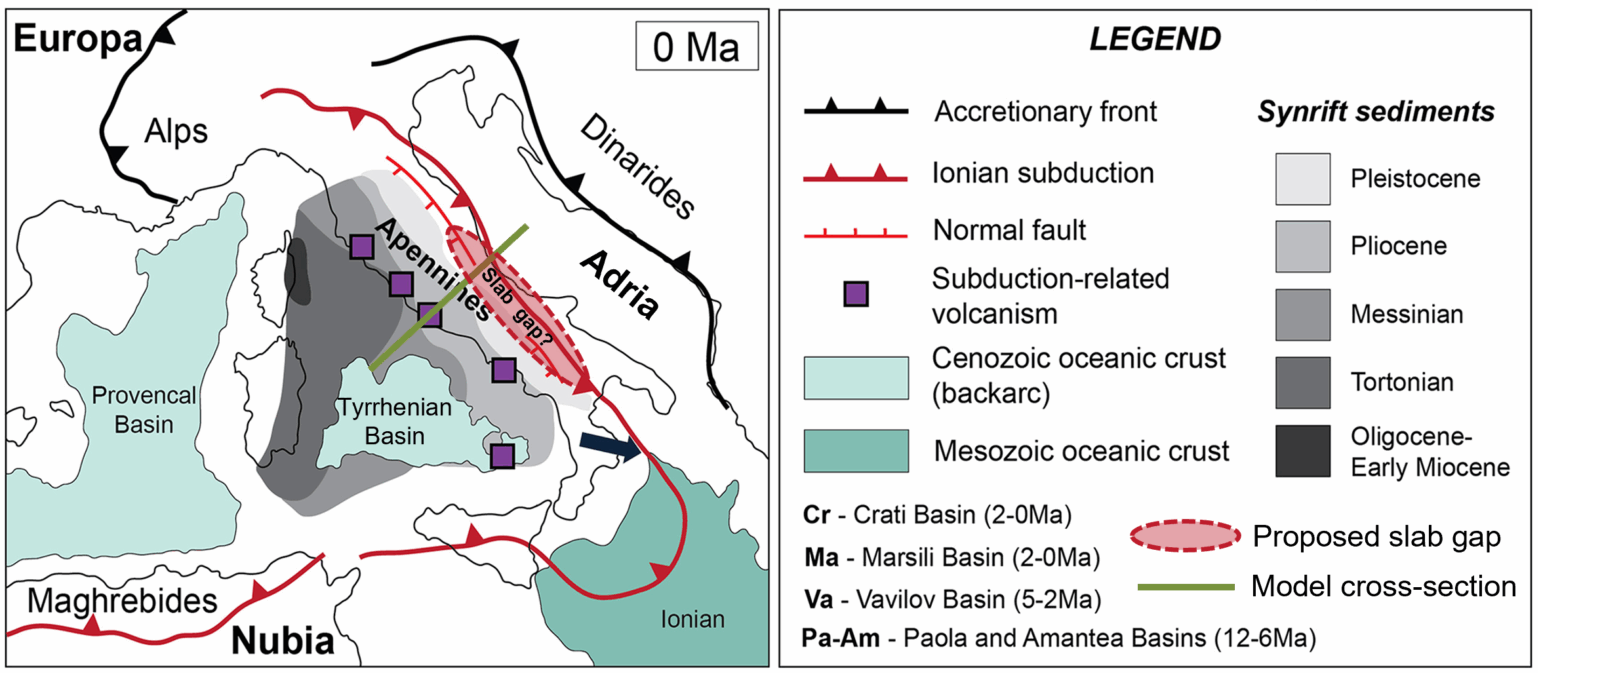
Figure 1: Adjusted from Filice and Seeber, 2019. Geodynamic settting of the Central Mediterranean, with the Adria microplate subducting in the Dinarides and in the Apennines. The model cross-section location of this study is indicated in green.
A striking difference in surface expressions exists between the northern and central Apennines. In the northern Apennines, continental subduction is active. A clear compressional front and subsidence in the Po Plain are present, while the orogen is under extension (e.g. Pina-Valdes et al., 2022). An eastward propagation of the onset of normal faulting in the orogen is observed, related to slab rollback (Lanari et al., 2023). In the central Apennines however, continental subduction seems to have ceased. No eastward propagation of the onset of normal faulting is observed and instead uplift and normal faulting at both sides of the drainage divide started simultaneously, indicating a symmetrical uplift pattern. Furthermore, river incision and oxygen isotope data show evidence for uplift of the central Apennines starting around 2.5 million years ago (Racano et al., 2024, San Jose et al., 2020). Finally, the central Apennines have a positive dynamic topography (Faccenna et al., 2014), indicating that the topography is higher than from isostasy and must be dynamically supported by the mantle.
All these observations hint in the direction of a slab break-off in the central Apennines that occurred around 2.5 million years ago. This could explain the uplift, extensional regime, symmetrical deformation, surface velocities and earthquakes. But wait, did someone test this hypothesis through geodynamic modeling? And what about other hypotheses? It is for example also suggested that extensional deformation in the central Apennines is caused , or by differences in gravitational potential energy. Furthermore, it remains uncertain whether the two continental Moho’s overlap or not. So that is where my research comes in: I am using geodynamic modeling to test these hypotheses and identify the key driving mechanisms of surface deformation and seismicity in the central Apennines.
Instantaneous seismo-thermo-mechanical modeling
For this, I am using the seismo-thermo-mechanical modeling approach (van Dinther et al., 2013). The model solves for the conservation of mass, momentum and energy and a strongly slip-rate dependent friction is used to introduce brittle instabilities. This model can simulate both the long-term geodynamic evolution and the seismic cycle, which I find super exciting as you can really study the interaction between geodynamics and seismicity.
As we want to study the present-day geodynamics and fault network, we are using an instantaneous modeling approach, i.e., we start from the present-day configuration. First, we run the model with timesteps of 200 years, to reach isostatic equilibrium and build up stresses. Then, the model is run with timesteps of 1 year to simulate the seismic cycle. For the Figure 2 we integrated a geological cross-section (Cosentino et al., 2010), Moho depth estimates from receiver functions, tomography and LAB estimates and surface heat flux to constrain the thermal structure. No widely accepted lithospheric scale cross-section was available for the central Apennines and these constraints still leave room for interpretation. Therefore, we systematically tested different structural variations (e.g. slab detached vs attached, Moho’s overlapping or not, delamination), rheological variations and different forcings (e.g. imposed plate velocity, imposed slab rebound). We compare the model deformation regime, surface velocities and earthquake focal mechanisms with the observations to choose the best-fit model.
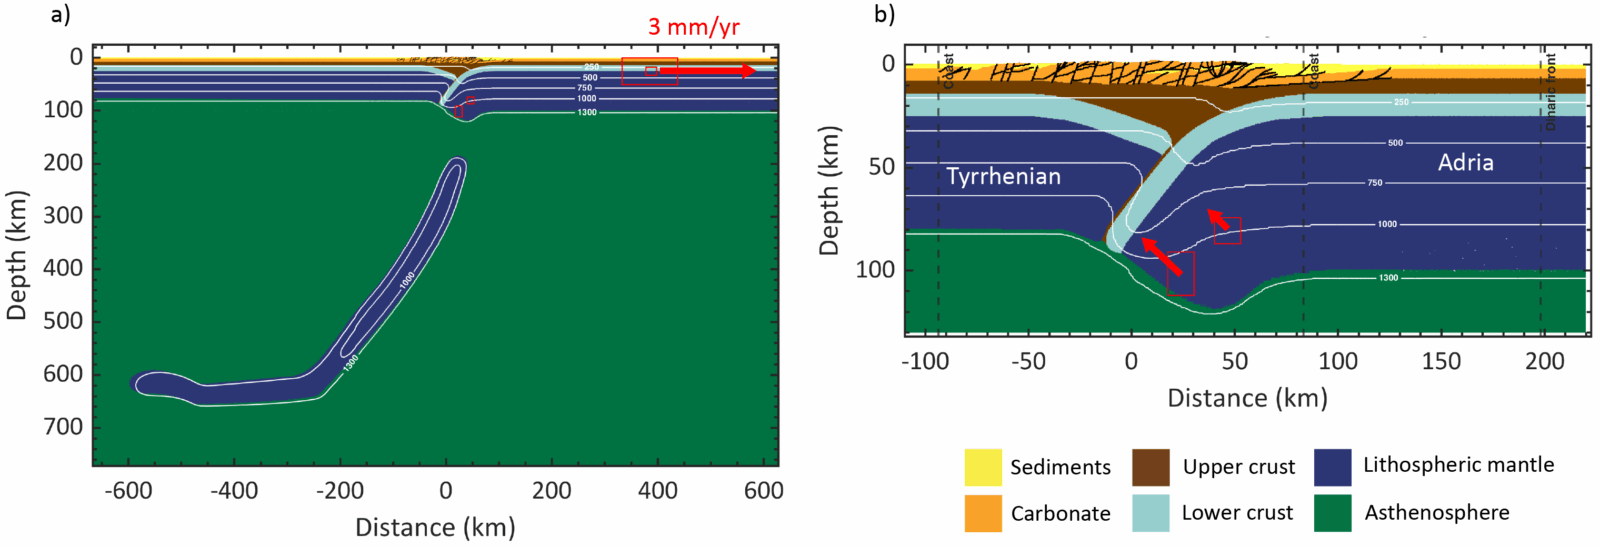
Figure 2: Initial setup of the best-fit model with key elements a detached slab, thin layer of upper crust subducting, imposed slab rebound and an imposed eastward Adria plate velocity of 3 mm/yr. a) full model, b) zoom of the area of interest.
Best-fit model: Detached slab and Moho’s overlapping
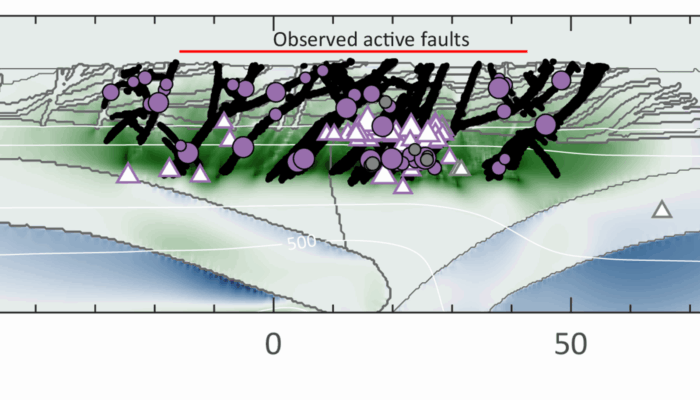
After running hundreds of models, I can confirm that the slab beneath the central Apennines has broken off. Key features of the best-fit model are a detached slab, imposed slab rebound of the slab remnant, a small layer of upper crust in the slab remnant and an imposed plate velocity of Adria of 3 mm/yr. With this model we are able to fit the area of observed active faulting (Figure 3), a predominantly extensional deformation regime onshore and slight compression offshore in the Adriatic Sea, as well as a gradual increase in horizontal surface velocities up to 3 mm/yr (Figure 4b).
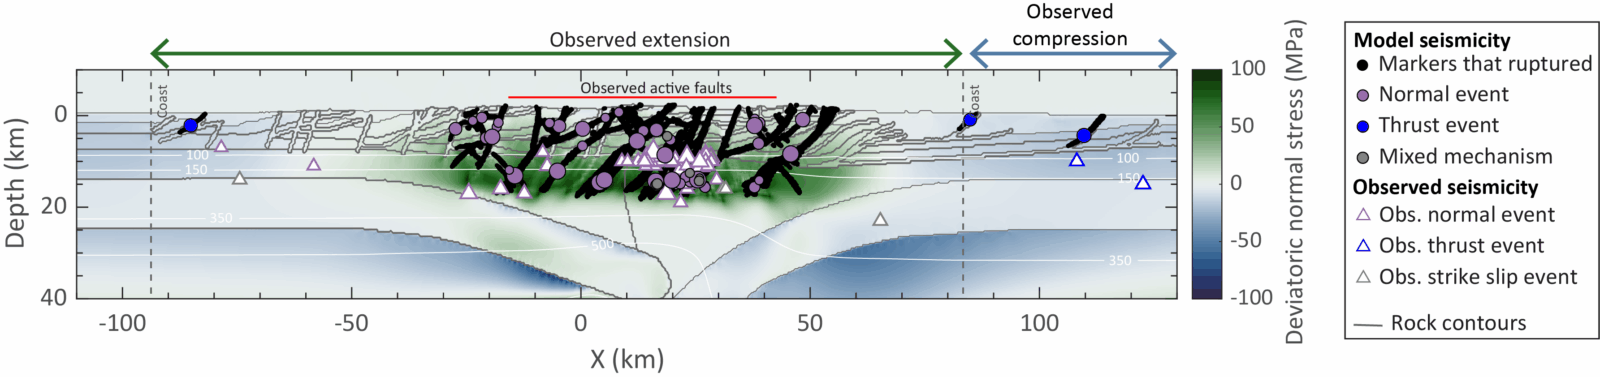
Figure 3: Best fit model seismicity and deformation regime compared to the observed focal mechanisms, deformation regime from the strain rate map and area of active faulting. Green indicates extension and blue compression.
An imposed slab rebound velocity, together with dynamic mantle support below the thinner Tyrrhenian plate, results in a small (up to 1 mm/yr) but large-scale uplift of the surface. This uplift is in agreement with geological uplift rates of 1 to 2 mm/yr, while it is not so clear in current GNSS and InSAR measurements (Figure 4a). Is this due to the low signal-to-noise ratio or has the uplift ceased in recent years?
Other key drivers of the extension are exhumation (eduction) of the subducted upper crust and eastward Adriatic plate motion. The exhumation of the subducted upper crust is driven by its positive buoyancy in combination with high temperatures, resulting in a low viscosity. This exhumation generates eastward extensional velocities that are transferred to the surface. This process is responsible for one third of the horizontal surface velocities that we observe with GNSS and InSAR.
Eastward plate motion of the Adriatic plate is another key driver of extension in the model, as it is responsible for 1.7 mm/yr of the 3 mm/yr horizontal velocities in the orogen (Figure 4b). We were not able to find a model that can generate all of the observed 3 mm/yr horizontal velocities in the orogen, while also sustaining most of this velocity offshore. Some models with strong crustal exhumation generated high velocities in the orogen, but these also quickly dropped moving away from the orogen, inducing a strong compressional field onshore near the Adriatic coast. To match the observed horizontal surface velocities, the imposed Adria plate motion plays a key role. We thus conclude that Adria plate motion is one of the main drivers of deformation in the central Apennines. This plate motion could derive from subduction of the eastern margin of the Adria microplate in the Dinarides. Analog modeling (Király et al., 2018) showed that in an outward dipping double-sided subduction zone, the entire plate moves toward the slab that has the largest subduction velocity. As the slab in the Apennines is partly detached, the Adria microplate could move towards the Dinarides.
Cutting off the topography in this best-fit model shows that differences in gravitational potential energy (GPE) arising purely from topography do not control the deformation regime. They contribute to near-surface extension and widen the area of active faulting, but to obtain the observed extension other drivers in the model are required.
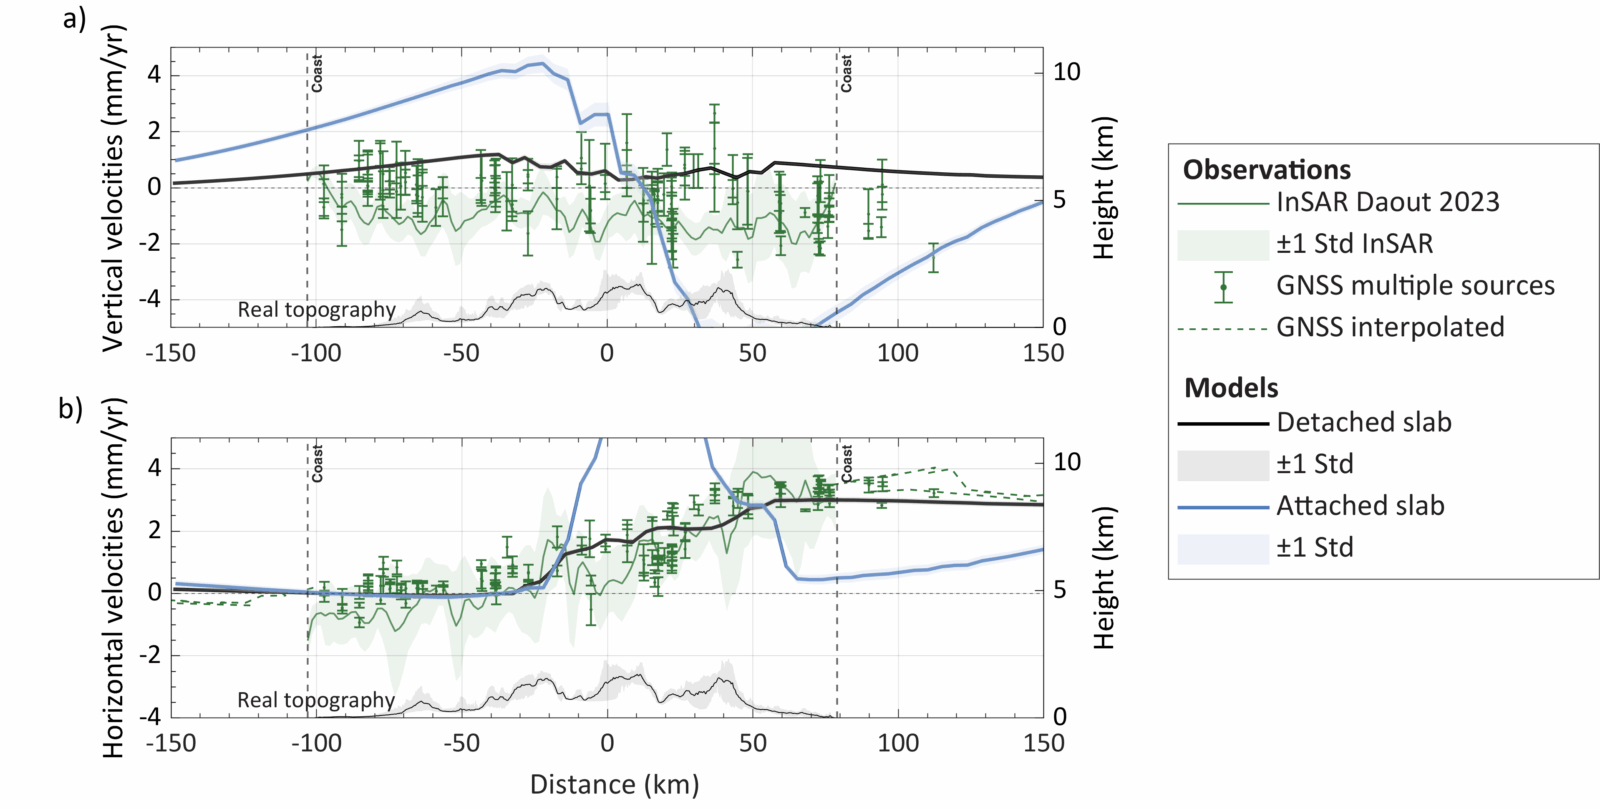
Figure 4: Model surface velocities versus observed surface velocities from GNSS and InSAR. The shown GNSS data is from Serpelloni et al., 2022, Pina-Valdes et al., 2022 and Daout et al., 2023. The detached slab model shows a good fit with the observations, whereas an attached slab is inconsistent with the observations.
Model variations
As a structural variation, we also run a model where the slab detached very shallow, leaving no Moho overlap of the two continental plates (i.e. no plate overlap). This model shows a less sufficient fit to the data than our preferred model with Moho overlap. Extensional deformation in this model is much more localized, above the asthenospheric wedge. Furthermore, compression is found onshore outside of the localized extensional area. We therefore conclude that a deeper slab break-off where the Moho’s are still overlapping is more likely.
We also run models where the slab is attached to test whether this configuration can also explain the observed surface deformation and seismicity (Figure 5). However, attached slab models show that the slab pull induces a strong compressional field with thrust earthquakes above the downgoing Adriatic plate, which is onshore near the Adriatic coast at the surface. This is not in line with our observations, which show extension onshore and no recorded thrust earthquakes onshore. Furthermore, an attached slab induces a distinctive pattern of uplift in the orogen, and subsidence above the downgoing Adriatic plate, also inconsistent with observations.
Strong sensitivities of model results are found to the exact Moho geometry by controlling the depth and thereby viscosity of the lower crust, thermal structure at the plate boundary zone and rheology of the upper and lower crust. This is a challenge for instantaneous modeling as these parameters are often poorly constrained.
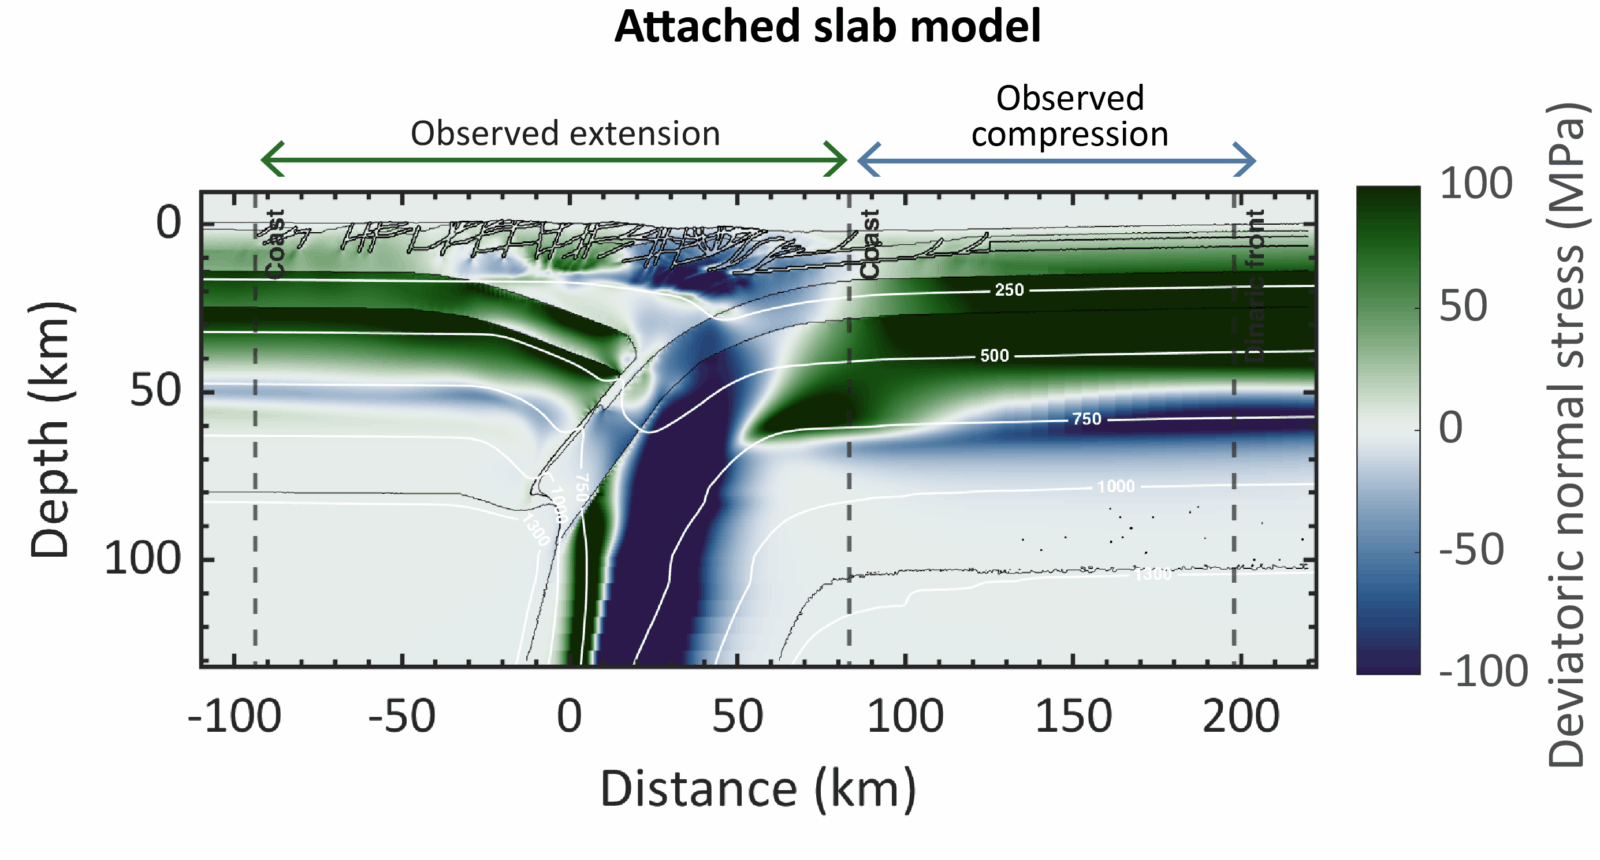
Figure 5: Deformation regime of the attached slab model. The observed compressional regime above the downgoing plate is inconsistent with the observed extension and the extension offshore in the Adriatic Sea is inconsistent with the observed compression.
Conclusions and outlook
So, coming back to the initial question and hypotheses: what is the main driver of seismicity and surface deformation in the central Apennines? My research shows that the slab beneath the central Apennines is indeed detached. But this fact alone is not sufficient to explain the observed surface deformation and seismicity. We also need eduction of the upper crust, as well as an independent plate motion of the Adria microplate to explain the observations.
Now that we’ve obtained a geodynamic setup that reproduces well the observations and thus correctly loads the fault network, I will focus on studying the seismic cycle in the central Apennines. We will use a similar model, but instead of minimum timesteps of 1 year, we will go to timesteps of milliseconds to fully resolve the earthquakes. So exciting times ahead!
We are planning to submit the content of this blogpost to JGR Solid Earth, so keep an eye out of if you are interested.
References

Cosentino, D., Cipollari, P., Marsili, P., & Scrocca, D. (2010). Geology of the central Apennines: a regional review. Journal of the Virtual Explorer , 36 . Retrieved 2023-12-18, from http://virtualexplorer.com.au/doi/00223 doi: 10.3809/jvirtex.2010.00223514

Lanari, R., Reitano, R., Faccenna, C., Agostinetti, N. P., & Ballato, P. (2023). Surface and Crustal Response to Deep Subduction Dynamics: Insights From the Apennines, Italy. Tectonics, 42 (3), 1–28. doi: 10.1029/2022TC007461


Piña-Valdés, J., Socquet, A., Beauval, C., Doin, M. P., D’Agostino, N., & Shen, Z. K. (2022). 3D GNSS Velocity Field Sheds Light on the Deformation Mechanisms in Europe: Effects of the Vertical Crustal Motion on the Distribution of Seismicity. Journal of Geophysical Research: Solid Earth, 127 (6), 1–25. doi:10.1029/2021JB023451

Piromallo, C., & Morelli, A. (2003, February). P wave tomography of the mantle under the Alpine-Mediterranean area. Journal of Geophysical Research: Solid Earth, 108 (B2), 2002JB001757. doi: 10.1029/2002JB001757

Racano, S., van der Beek, P., Schildgen, T., Faccenna, C., Buleo Tebar, V., & Cosentino, D. (2024, July). Slab Driven Quaternary Rock-Uplift and Topographic Evolution in the Northern-Central Apennines From Linear Inversion of the Drainage System. Geochemistry, Geophysics, Geosystems, 25 (7)

Rappisi, F., VanderBeek, B. P., Faccenda, M., Morelli, A., & Molinari, I. (2022). Slab Geometry and Upper Mantle Flow Patterns in the Central Mediterranean From 3D Anisotropic P-Wave Tomography. Journal of Geophysical Research: Solid Earth, 127 (5), 1–22. doi: 10.1029/2021JB023488

San Jose, M., Caves Rugenstein, J. K., Cosentino, D., Faccenna, C., Fellin, M. G., Ghinassi, M., & Martini, I. (2020, August). Stable isotope evidence for rapid uplift of the central Apennines since the late Pliocene. Earth and Planetary Science Letters, 544 , 116376. Retrieved 2024-09-19, from https://linkinghub.elsevier.com/retrieve/pii/S0012821X20303204 doi: 10.1016/j.epsl.2020.116376

Van Dinther, Y., Gerya, T. V., Dalguer, L. A., Mai, P. M., Morra, G., & Giardini, D. (2013). The seismic cycle at subduction thrusts: Insights from seismo-thermo- mechanical models. Journal of Geophysical Research: Solid Earth, 118 (12), 6183–6202. doi: 10.1002/2013JB010380682


Elsiddig Salah
WOW! i really like this @Maaike .. thank you so much and good luck