Both earthquakes and research project directions can be hard to predict. This week Becky Fildes, a graduate student at UC Davis, takes us on a journey of how she came to study earthquake behavior in Hawaii during an active volcanic eruption and how our understanding of caldera collapses can be further improved.
Becky Fildes is a PhD candidate at the University of California, Davis.
In my first year of graduate school in 2017, I had started studying earthquake statistics of aftershock sequences in southern California, USA. I was focused on some large ~Mw 7 earthquakes that were each followed by an active aftershock sequence that generally followed the expected aftershock decay behavior. One of the other faculty in the department along with a graduate student of theirs had recently been testing out applying a newer earthquake hazard assessment technique to earthquakes that uses a concept called “natural time”, which uses small magnitude earthquakes to estimate the occurrence of larger magnitude events (Rundle et al., 2016). My advisor at the time, Dr. Louise Kellogg, and I decided to try to apply this earthquake hazard assessment technique to the aftershock sequences of those large southern Californian earthquakes I had been studying. This project soon took an unexpected, but exciting shift towards volcanic seismicity, a topic I had not thought much about before.
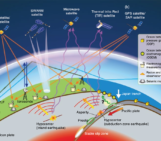
Towards the end of my first year, in early May 2018, there was a large Mw 6.9 earthquake near Kīlauea Volcano on the island of Hawai’i, in Hawaii, USA. This was followed by changes in seismic and volcanic activity observed at the volcano including earthquakes at the summit of the volcano and lava flows in its lower East Rift Zone (Figure 1). Our department has a weekly Friday Lunch Seminar where the topics and types of talks vary from student practice talks to skill tutorials. In June 2018, while this Kīlauea eruption was ongoing, one of the former Chief Scientists at the United States Geological Survey (USGS) Hawaiian Volcano Observatory (HVO), Dr. David Clague, happened to be on a visit to our department using one of our labs. He stepped in and gave one of these Friday Lunch Seminars, titled, “Up date on the on-going Kilauea eruption”. His talk included updates on where fissures were opening, volumes of lava that had erupted, how the volcano was being monitored, and the high level of earthquake activity being seen at the summit of the volcano. He described how the structure of the summit region of the volcano was being altered through ~Mw 5.0 earthquakes every day or so in a quasi-periodic pattern, accompanied by swarms of hundreds of small magnitude earthquakes (Figure 2). This pattern of seismicity caught the attention of my advisor and I and this segued into us deciding to shift from studying the southern California earthquakes I had been looking at, to this remarkable set of earthquakes occurring at Kīlauea.
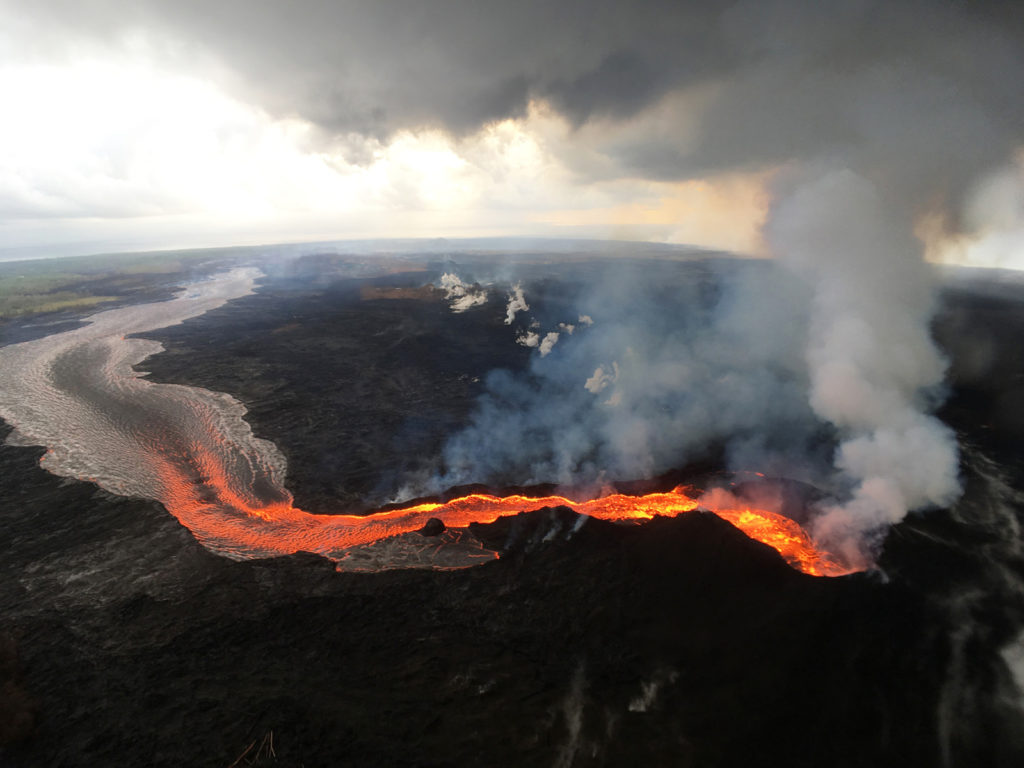
Figure 1: Photograph of rapidly flowing lava coming out of the fissure 8 cone (lower right) that erupted in Kīlauea’s lower East Rift Zone during the 2018 eruption.
Photograph by M. Patrick, USGS on July 29, 2018 (https://www.usgs.gov/media/images/fissures-were-characterized-low-eruption-rates).
This was an exciting shift in research for a few reasons. First, with the eruption being ongoing, we had the chance to study these earthquakes in real-time as the eruption was still unfolding. Due to the efforts of the USGS and HVO staff and scientists who maintained the instruments (e.g., seismometers, GPS, tiltmeters) and processed the data throughout the eruption, we were able to use the earthquake data they put in the open-source USGS earthquake catalog (https://earthquake.usgs.gov/earthquakes/search/). This allowed us to follow along with their data as the quasi-periodic earthquake sequence continued on and to stay-up-to date on changes to the larger volcanic system. The second reason this was an exciting shift in research, is that these volcanic earthquakes were behaving very differently than the earthquakes we had been studying in southern California. Instead of seeing a typical aftershock sequence you would expect following each ~Mw 5 seismic event at the summit, we instead saw, a period of little to no earthquake activity. Following this quiescent time, there was an increase in activity leading up to the proximal ~Mw 5 seismic event. This pattern continued to repeat itself between each collapse event (Figure 3). Over the course of this eruption, the summit of Kīlauea saw 62 collapse events that produced seismic signals of Mw 4.7 to Mw 5.4, where these collapses were occurring almost daily (Neal et al. 2019). All of these collapse events were preceded by earthquake swarms of hundreds of smaller magnitude (M ) earthquakes located around the summit caldera (Neal et al. 2019).
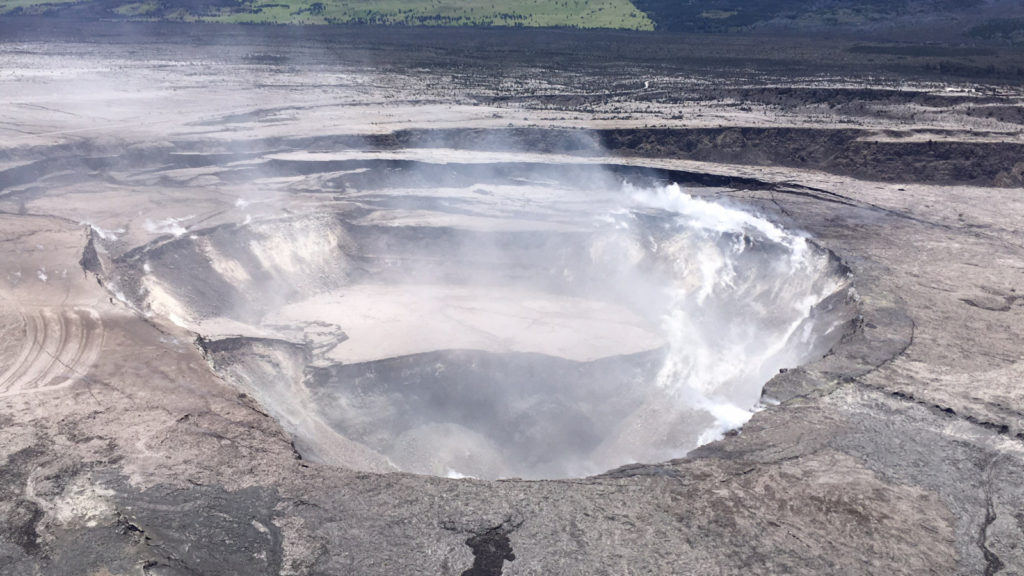
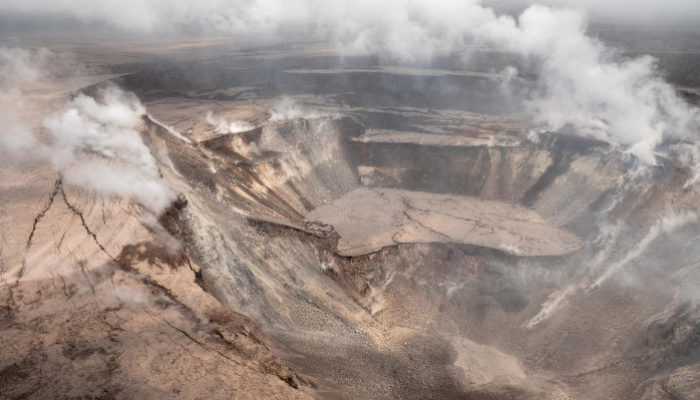
Figure 2: Photograph of Kīlauea’s summit in early June (partway through the eruption) which underwent a lot change due to the collapse events and earthquakes. It continued to evolve beyond this due to to the large collapse events and seismicity that continued to occur until early August. Photograph by Hawaiian Volcano Observatory on June 5, 2018 (https://www.usgs.gov/media/images/k-lauea-volcano-halema-uma-u-crater-aerial)
This seemingly repetitive, but contrasting to aftershock behavior, seismicity between collapse events was very intriguing. Although the original goal with this new data set was to try applying the natural time seismic hazard technique we were working with in California, we put that on pause to focus on this inter-event (event refers to the ~Mw 5 collapse events) seismicity activity. We broke down in detail each inter-event pattern of seismicity and looked at a few different characteristics to look for any temporal changes in behavior. We did find some changes in seismicity behavior in early-mid June which we note in our study (Fildes et al., 2020). We followed the eruption until it’s abrupt pause in early August 2018. After that detour into the inter-event seismicity statistics study, I returned to the idea of applying the seismic hazard assessment technique we had originally wanted to explore in this setting and pursued this study (Fildes et al. (2022) manuscript currently under review). With the wealth of other data types both geochemical and geophysical collected through-out the eruption, our hope is that our seismicity-focused studies could be compared with others’ work and our findings on changes in earthquake behavior may be correlated to other changes in the volcanic system.
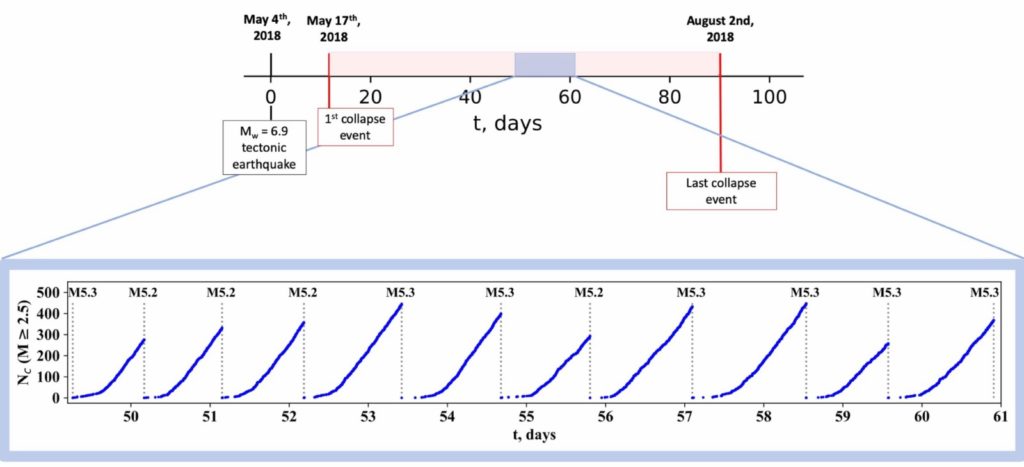
Figure 3: Figure from Fildes et al. (2020): “A subset of the … interevent periods which illustrates the repetitive pattern of seismicity observed between summit … seismic events. The cumulative number Nc of M earthquakes is given as function of time t. The vertical lines indicate the occurrence of a large collapse event and its magnitude is noted. The cumulative count of earthquakes resets to zero after each large event.”
It was fascinating to study the eruptive sequence as it unfolded and not knowing when changes in activity would occur, or when the eruption may take a pause or end. Caldera collapse eruptions have occurred at other volcanoes around the world, but this is the best monitored sequence of events like it. This wealth of new data sets provides the opportunity to study this system from multiple foci and try to find correlations across physical changes seen in the volcanic system. Although these projects were unexpected and not a part of my original research goals, it was a great opportunity to learn about different earthquake behavior and take advantage of a new data set for an event that hadn’t even occurred yet when I started graduate school. Even though I won’t be focused on this eruptive sequence during the remainder of my PhD, I am looking forward to continuing to follow the variety of studies that come out on this 2018 Kīlauea Volcano eruption that may help us better understand caldera forming eruptions!
Reference:

Fildes, R.A., Turcotte, D.L., & Rundle, J.B. (2022). Natural time analysis and nowcasting of
quasiperiodic collapse events during the 2018 Kīlauea volcano eruptive sequence. Manuscript submitted for publication.

Fildes, R. A., Kellogg, L. H., Turcotte, D. L., & Rundle, J. B. (2020). Interevent seismicity
statistics associated with the 2018 quasiperiodic collapse events at Kīlauea, HI, USA.
Earth and Space Science, 7, e2019EA000766. https://doi.org/10.1029/2019EA000766

Neal, C. A., Brantley, S. R., Antolik, L., Babb, J. L., Burgess, M., Calles, K., et al. (2019). The
2018 rift eruption and summit collapse of Kīlauea Volcano. Science, 363(6425),
367–374. https://doi.org/10.1126/science.aav7046

Rundle, J. B., Turcotte, D. L., Donnellan, A., Ludwig, L. G., Luginbuhl, M., & Gong, G. (2016).
Nowcasting earthquakes. Earth and Space Science, 3(11), 480–486.
https://doi.org/10.1002/2016EA000185