For today blog, we have interviewed Clemens Eisank about OBIA and its application in Natural Hazard.

Dr. Clemens Eisank is Remote Sensing Specialist & Project Manager at GRID-IT Company in Innsbruck (Austria). He obtained his Ph.D. from the Department of Geoinformatics – Z_GIS at Salzburg University in 2013. In his Ph.D. research, he proposed a workflow for automated geomorphological mapping with object-based image analysis (OBIA) methods. His research interests include remote sensing based mapping/monitoring of natural hazards and the development/automation of the related information extraction workflows and tools. During his career, he has worked on several research projects on natural hazards related topics.
1) Hi Clemens, can you tell us what OBIA is in simple words?
OBIA is short for Object-Based Image Analysis. OBIA is a powerful framework for the analysis and classification of gridded data, especially images. A typical OBIA workflow includes two steps:
- Segmentation to generate so-called “objects”. Objects are created by merging adjacent grid cells (pixels) of the input grid layer(s) based on specific criteria. For merging pixels into objects, many segmentation algorithms evaluate the similarity of pixel values against a user-defined threshold (fig. b).
- Classification of objects. Objects are defined by a plethora of attributes, including spectral (e.g. pixels mean brightness), geometrical (e.g. maximum slope) and spatial properties (e.g. relative border to class X). Based on statistical learning or knowledge models the best set of attributes is identified for each target class and used for object-based classification of the input grid layers (fig. c).
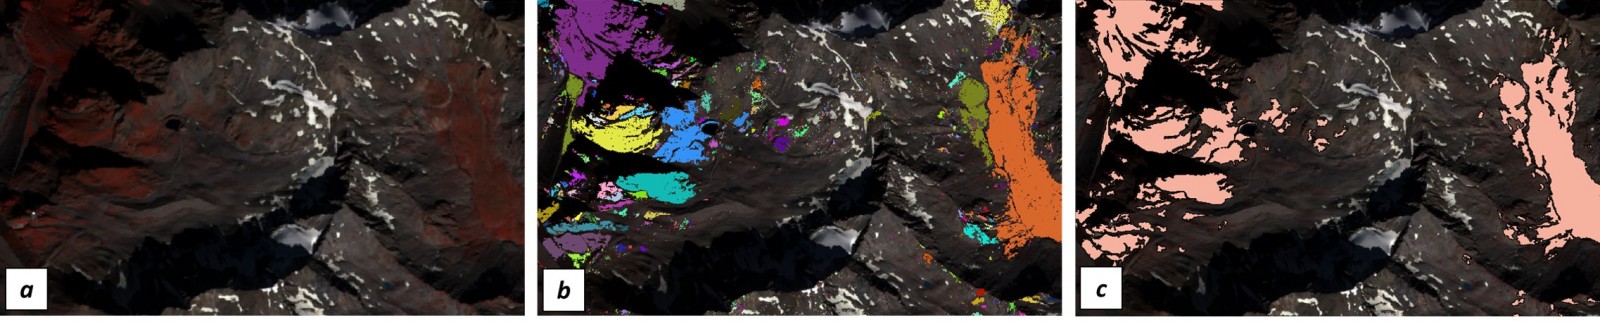
Image in fig. a is segmented in different objects (fig. b), which are classified as one class, i.e. “moraine deposits” (fig. c). Image credit: Gabriele Amato & GRID-IT Company.
In general, the segmentation and classification steps are applied in a cyclic manner to obtain an accurate classification result. Compared to pixel-based classification, OBIA results are more realistic, more accurate and visually more appealing, since the “salt-and-pepper” effect, which is typical in pixel-based classifications, is avoided. Moreover, classification results are typically in vector format allowing for straightforward integration with other GIS layers.
One reason for the success of OBIA may be the fact that it mimics human perception: humans perceive the world as an assemblage of discrete entities such as trees, mountains, buildings; they name these entities and distinguish them by properties such as colour, shape and spatial setting. In the OBIA world, objects are the digital representation of the perceived real-world entities, and the digital properties can be directly associated with the properties that humans use to distinguish different categories of real-world entities.
2) Why do you think OBIA can give a contribution in the field of Risk Assessment?
For a proper risk assessment, a comprehensive geodatabase with all kinds of layers ranging from terrain data and geology to images has to be established for the region of interest. OBIA is a great framework for integrating all these data coming at different spatial resolutions and for extracting the relevant risk information (e.g. risk zones), especially via the use of “objects”. By analysing multi-temporal data, natural-hazard objects such as landslides can be identified as polygons or the evolution of natural hazard objects can be monitored, including the change in attributes such as shape, which may help to improve the understanding of the relevant surface processes. Other application scenarios are that natural hazard polygons, which have been extracted by OBIA, are used (1) as constraining areas for optimization of susceptibility models or (2) as basis for the mapping of risk “hot spots”.
3) In which kind of Natural Hazard do you think OBIA can provide the best performance?
OBIA performs best in detection scenarios’ changes: in other words when two or more images of the same area are compared. One prominent application example is the automated mapping of a new landslide to create event-based landslide inventories: a post-event image is segmented (ideally, in combination with terrain layers) and bare soil objects are automatically extracted using spectral, terrain and other thresholds. The extracted bare soil objects are put on top of a pre-event image and pre-event object properties are recorded. If a significant difference between pre- and post-event object properties (e.g. NDVI) is observed, these objects are regarded as new landslide areas and added as polygons to the existing landslide inventory. By repeating this extraction, a complete detailed landslide inventory can be established at national and regional scale. Such an inventory will be more objective than inventories usually created by multiple people with different background and experience.
4) In this regard, could you tell us something about the research projects you are involved in?
We have just finished a project on improving object-based landslide mapping (Land@Slide). The focus was on increasing the robustness and flexibility of object-based landslide mapping algorithms. These algorithms should deliver high-quality landslide mapping results for different kinds of optical satellite data with varying spatial and spectral resolution. In close cooperation with potential end-users, we gathered the desired requirements and identified application scenarios ranging from landslide rapid mapping to inventory mapping. The improved algorithms were implemented in a prototypical web processing service, which allows the users to map landslides online by themselves.
Currently, I am managing the MorphoSAT project which can be seen as follow-up project of my PhD research. The idea is to bring digital geomorphological mapping to the next level. The motivation of this research is that digital geomorphological information is required for many applications (also in natural hazards), but is only rarely available for most regions of the world. We are positive that we can provide improved algorithms based on OBIA for automated extraction of geomorphological features (e.g. landforms, process domains) in digital terrain layers.
5) Which are the OBIA future perspectives?
I think the impact of OBIA will constantly increase in the future. OBIA has proven to be a powerful framework for integrative 2D data analysis. However, additional functions and methods are needed to analyse data in 3D and 4D, especially for multi-temporal LiDAR point clouds. OBIA will be of great value also for tracing objects in video streams such as the already recorded ones by mini satellites. We will hopefully also see new OBIA software tools that can reach the quality of commercial products. Especially in the open-source world, OBIA tools are still rare. Free tools are needed to widen the user community and to strengthen the position of OBIA as an innovative geodata analysis framework, also in the field of natural hazards.