Is it a good day to have a meltdown? It’s cold and there is sun outside, neh maybe not. Procrastinating even having a meltdown. But this audience doesn’t even let me do that. Today, we’re answering Kai’s question: Why do we consider leaving academia a failure? Dear Kai, Sorry, the question ended up in my spam folder, otherwise, I’m pretty sure that I wouldn’t ignore poking the hornet’s ...[Read More]
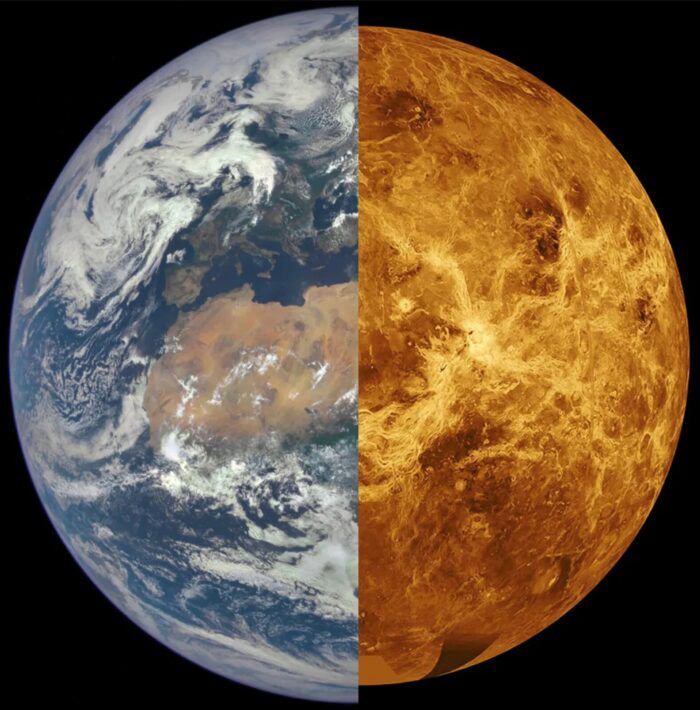
How numerical modeling helps decipher the dynamics and evolution of Venus
Earth’s sister, Venus, is a planet whose evolution is drastically different from our own. Unravelling the hidden mysteries behind the divergent evolution of these two planets could hold the key to understanding what makes a planet habitable. Using numerical modelling, Diogo Lourenço and Cédric Gillmann unveil the dynamics of Venus while linking them to observations. In today’s blog pos ...[Read More]
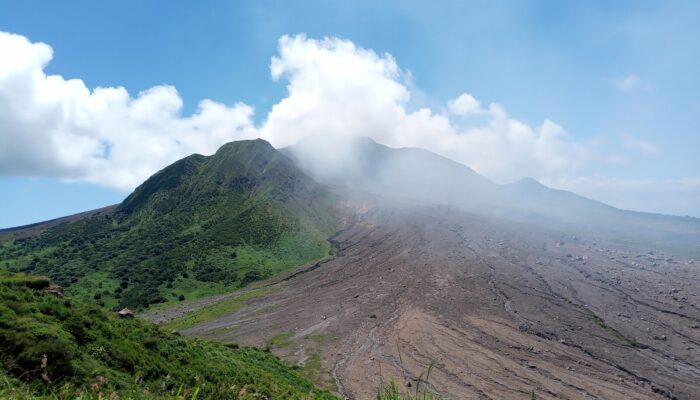
Between the Volcano and the Deep Blue Sea: Tales from Montserrat (Part 2)
In 1995, the Caribbean Island of Montserrat was shaken by the beginning of one of the most significant volcanic eruptions in recent history: one that profoundly changed the natural, social and economical landscape of the country. Three decades later, Soufrière Hills Volcano and its legacy of destruction still shape the lives of Montserrat’s people. Last October, we took you on the first half of ou ...[Read More]
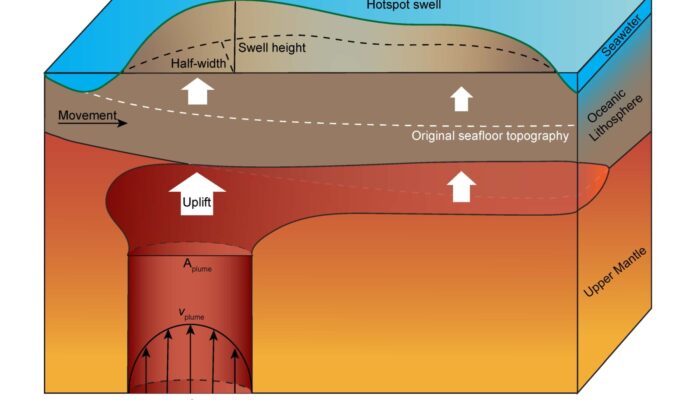
New Insights into Plume Buoyancy Fluxes and Dynamic Topography from Numerical Modelling
Figure 1. Illustration of the hotspot swell and plume buoyancy flux. White dashed line shows the original seafloor topography due to half-space cooling. Dark green line represents the surface dynamic topography caused by the dynamic uplift of the plume. One of the main surface expressions of dynamic topography are hotpot swells formed by mantle plumes. In this week’s post, Ziqi Ma, PhD candi ...[Read More]


