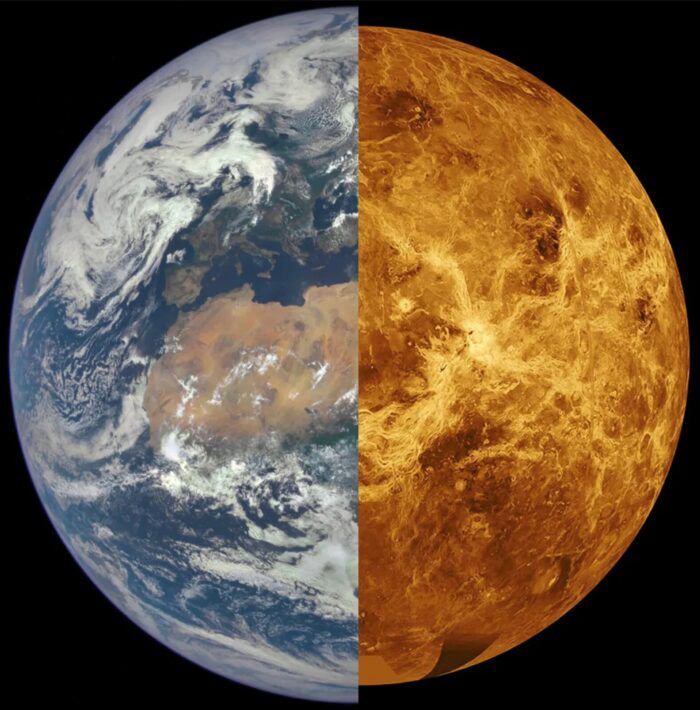
Earth’s sister, Venus, is a planet whose evolution is drastically different from our own. Unravelling the hidden mysteries behind the divergent evolution of these two planets could hold the key to understanding what makes a planet habitable. Using numerical modelling, Diogo Lourenço and Cédric Gillmann unveil the dynamics of Venus while linking them to observations. In today’s blog post, we dive into Venus’s conundrum and how numerical modelling can help us better understand this planet and its evolution.

Dr. Cédric Gillmann is a Senior Researcher at the Department of Earth and Planetary Sciences at ETH Zurich. Working on Venus, his research mainly focusses on the feedbacks between long-term planetary dynamics and Venusian atmosphere.

Dr. Diogo Lourenço is a Senior Researcher at the Department of Earth and Planetary Sciences at ETH Zurich. Currently working on dynamics of Venus, his research interests range from planetary and mantle dynamics to past and future tectonic regimes. You can reach out to him at: diogo.lourenco@eaps.ethz.ch
Introduction
Venus and Earth are neighboring planets with similar sizes and compositions, and they likely formed in a similar manner. We might thus expect their subsequent evolution and present-day conditions to be alike. However, this is clearly not the case; in fact, their surface environments are vastly different. While Earth’s mild conditions support life, Venus has an average surface temperature of approximately 737 K (464°C) and a surface pressure about 92 times that of Earth’s. This significant disparity indicates that Earth and Venus have undergone different evolutionary pathways over the past 4.5 billion years. Understanding Venus’ evolution provides valuable insights into the diversity of planetary evolutionary pathways and the factors that influence planetary habitability.
A major challenge in understanding Venus’ evolution is the lack of observational data, even compared to other neighbouring planets like Mars. We have very limited information about Venus’ interior and only sparse data about its surface, while a few noble gases and isotopic measurements provide a unique glimpse of its mysterious past. This scarcity of data is primarily due to Venus’ extreme surface conditions: the longest-lasting lander, the Soviet Venera 13 mission in 1982, survived for just 2 hours and 7 minutes. This is where numerical models play an important role: they allow us to test various scenarios to better interpret existing observations, study familiar processes under different conditions (such as planetary tectonics on a hotter surface), and also help in the planning of future missions.
In the following sections, we present two examples of ongoing research projects within our group, the Geophysical Fluid Dynamics group at ETH, aimed at deciphering the dynamics and evolution of Venus.
Case study 1: core size
On Earth, we have excellent constraints on core size primarily due to seismology. In contrast, Venus lacks seismological data, and the use of other indirect geophysical methods is limited by its thick atmosphere and slow rotation. Venus has the slowest rotation of any planet in the Solar System, taking 243 Earth days to complete a full rotation on its axis. Consequently, combined with the poorly constrained chemical composition of Venus, there is a high degree of uncertainty regarding its internal structure.
Various studies have attempted to address this issue. A recent study by Shah et al. (2022) explored a range of possible bulk compositions and internal structures for Venus. Their models, calibrated to match Venus’ observed moment of inertia and total mass, predict core radii ranging from 2,930 to 4,350 km, with significant variations in both mantle and core composition.
In our study, we pick ten different Venus models from Shah et al. (2022) that range from a small Sulphur-free (S-free) to a big Sulphur-rich (S-rich) core. The basic idea is that a S-rich core is larger due to its lower density compared to a S-free, denser iron core, which results in a smaller size. We then run mantle convection evolution models for the different scenarios using the code StagYY (Tackley, 2008; Armann and Tackley, 2012) and explore how different interior structures and chemical compositions affect the long-term evolution and dynamics of Venus over 4.5 billion years.
In our models, the bulk composition of the mantle affects the basalt fraction and the solidus and liquidus temperature profiles. For example, the richer the core is in S, the poorer the mantle becomes, and thus the melting point is higher. We investigate how the composition and size of the core affects magmatism, and hence the outgassing of water and other volatiles into the atmosphere, the basalt distribution, heat flow, temperature of the mantle and lithosphere, and observables such as the moment of inertia factor and Love numbers. The moment of inertia of a planet is a measure of how mass is distributed within it relative to its axis of rotation, while the Love number k2 is a measure of how easy it is to deform the body on a large spatial scale.
Since the tectonic regime on Venus is still unknown, we test different evolution scenarios for a planet covered by a stagnant lid (a rigid single-plate planet), an episodic lid (an unstable stagnant lid that overturns periodically into the mantle), and a plutonic-squishy lid (characterized by small, strong plates separated by warm, weak regions formed by plutonism). The active tectonic regime is controlled by both the yield stress, which is the stress needed to break the lithosphere, and the extrusion efficiency, which is the proportion of the melt generated above the depth of neutral buoyancy that is erupted forming cold crust, with the remainder being intruded into the crust.
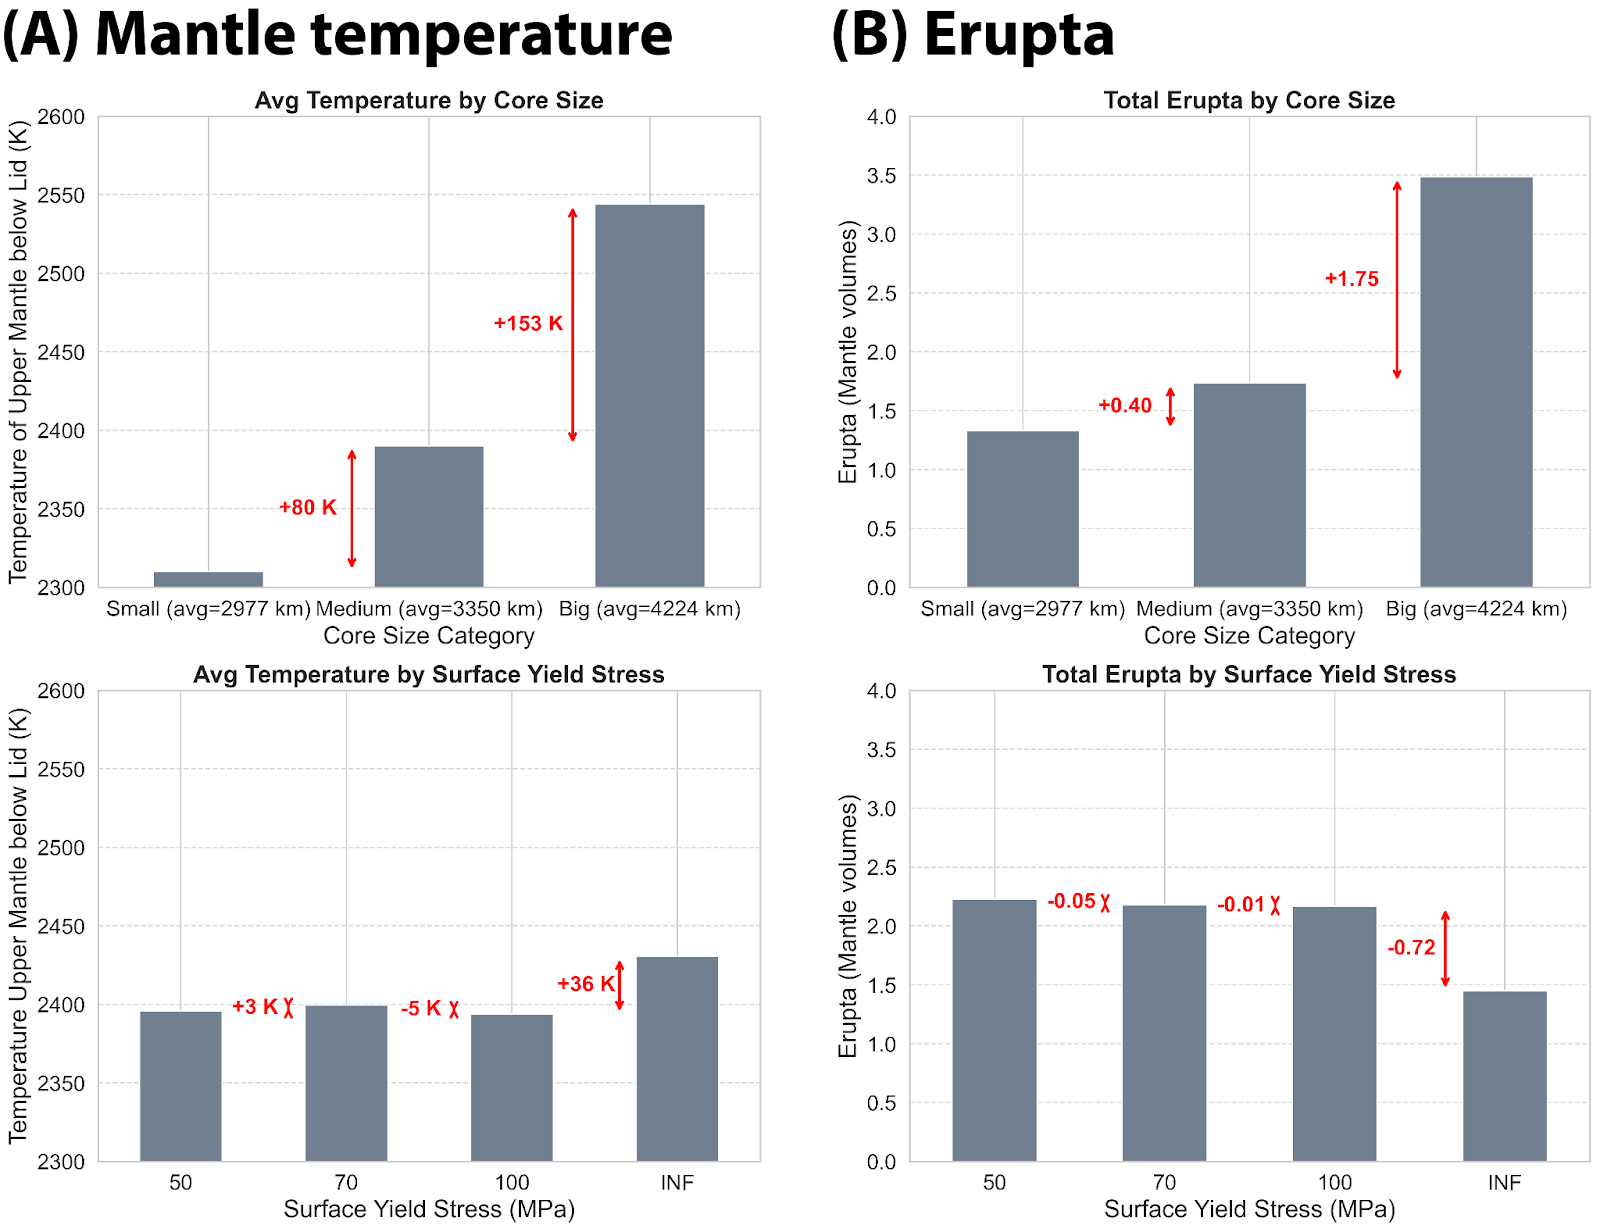
Figure 1 presents some of our key findings. It shows that the core size and composition of the mantle have the strongest influence on mantle temperatures: slower convection and harder to melt mantle material (initially) for thinner mantles lead to higher internal temperatures. The active tectonic regime has a lesser impact because melting is efficient at cooling the mantle, either through a squishy lid (intrusion) or heat pipe (eruption).
Erupta, which is the integrated eruption rate over the whole evolution of the planet and therefore is a proxy for mantle outgassing, increases with decreasing mantle thickness (associated with S-rich cores). This is because thinner mantles remain warmer, and more basalt is available closer to the surface due to enhanced surface mobility. Conversely, erupta decreases with increasing yield stress, as reduced lithospheric mobility leads to less volcanic activity.
In conclusion, variations in bulk composition significantly influence mantle temperatures, with larger S-rich cores resulting in hotter mantles. To better understand eruption rates and outgassing, it is essential to investigate three key factors: the evolution of mantle temperature, local basalt enrichment within the mantle, and the tectonic regime (mobility). Finally, our findings suggest that models with medium-sized cores containing some light elements better fit to k2 , due to smaller solid inner cores, indicating that Venus probably has an Earth-like structure.

Figure 1: Statistics for different runs grouped by core size (top) and surface yield stress (bottom). Shown are upper mantle temperature excluding the lithosphere (left) and erupta (right).
Case study 2: Baltis Vallis
A result from past missions, namely Magellan, is our relatively good and near global knowledge of the topography of Venus. Topography is important because it is governed by the interior structure and dynamics of the planet. Therefore, observing the surface of Venus could give us clues as to how its interior behaves. This is, for example, the reasoning behind the idea that Venus lacks Earth-like plate tectonics: we do not see at Venus’ surface the clear pattern of plates, ocean/continent dichotomy and magmatic features distribution. Generally speaking, topography can be sustained in two main ways: passive and active. Passive topography relies on isostatic equilibrium to maintain elevation variations (thick continental crust is buoyant in the mantle and creates high topography). Active topography implies that convection in the mantle creates topography: an upwelling would lead to higher elevations, for example. On Venus, it has long been hypothesized that topography was mainly sustained by mantle dynamics (except in the highlands, McKenzie, 1994), due to its high correlation with the venusian geoid (Herrick & Phillips, 1992).
Different properties of the mantle, which govern the convection and mantle flows, would lead to different expressions of topography on the surface. Modelling the interior dynamics of Venus, calculating the dynamic topography and comparing it to observations would yield insights regarding the interior of a planet that is so complicated to unveil. However, how can we compare local variations at the surface of a specific, real object to numerical results? One way to do so is to look at the global spectral analysis of the topography, to assess the characteristics of topography and bypass the need for local comparison. This is the main method for such studies and has been successfully used, for example by Rolf et al. (2018).
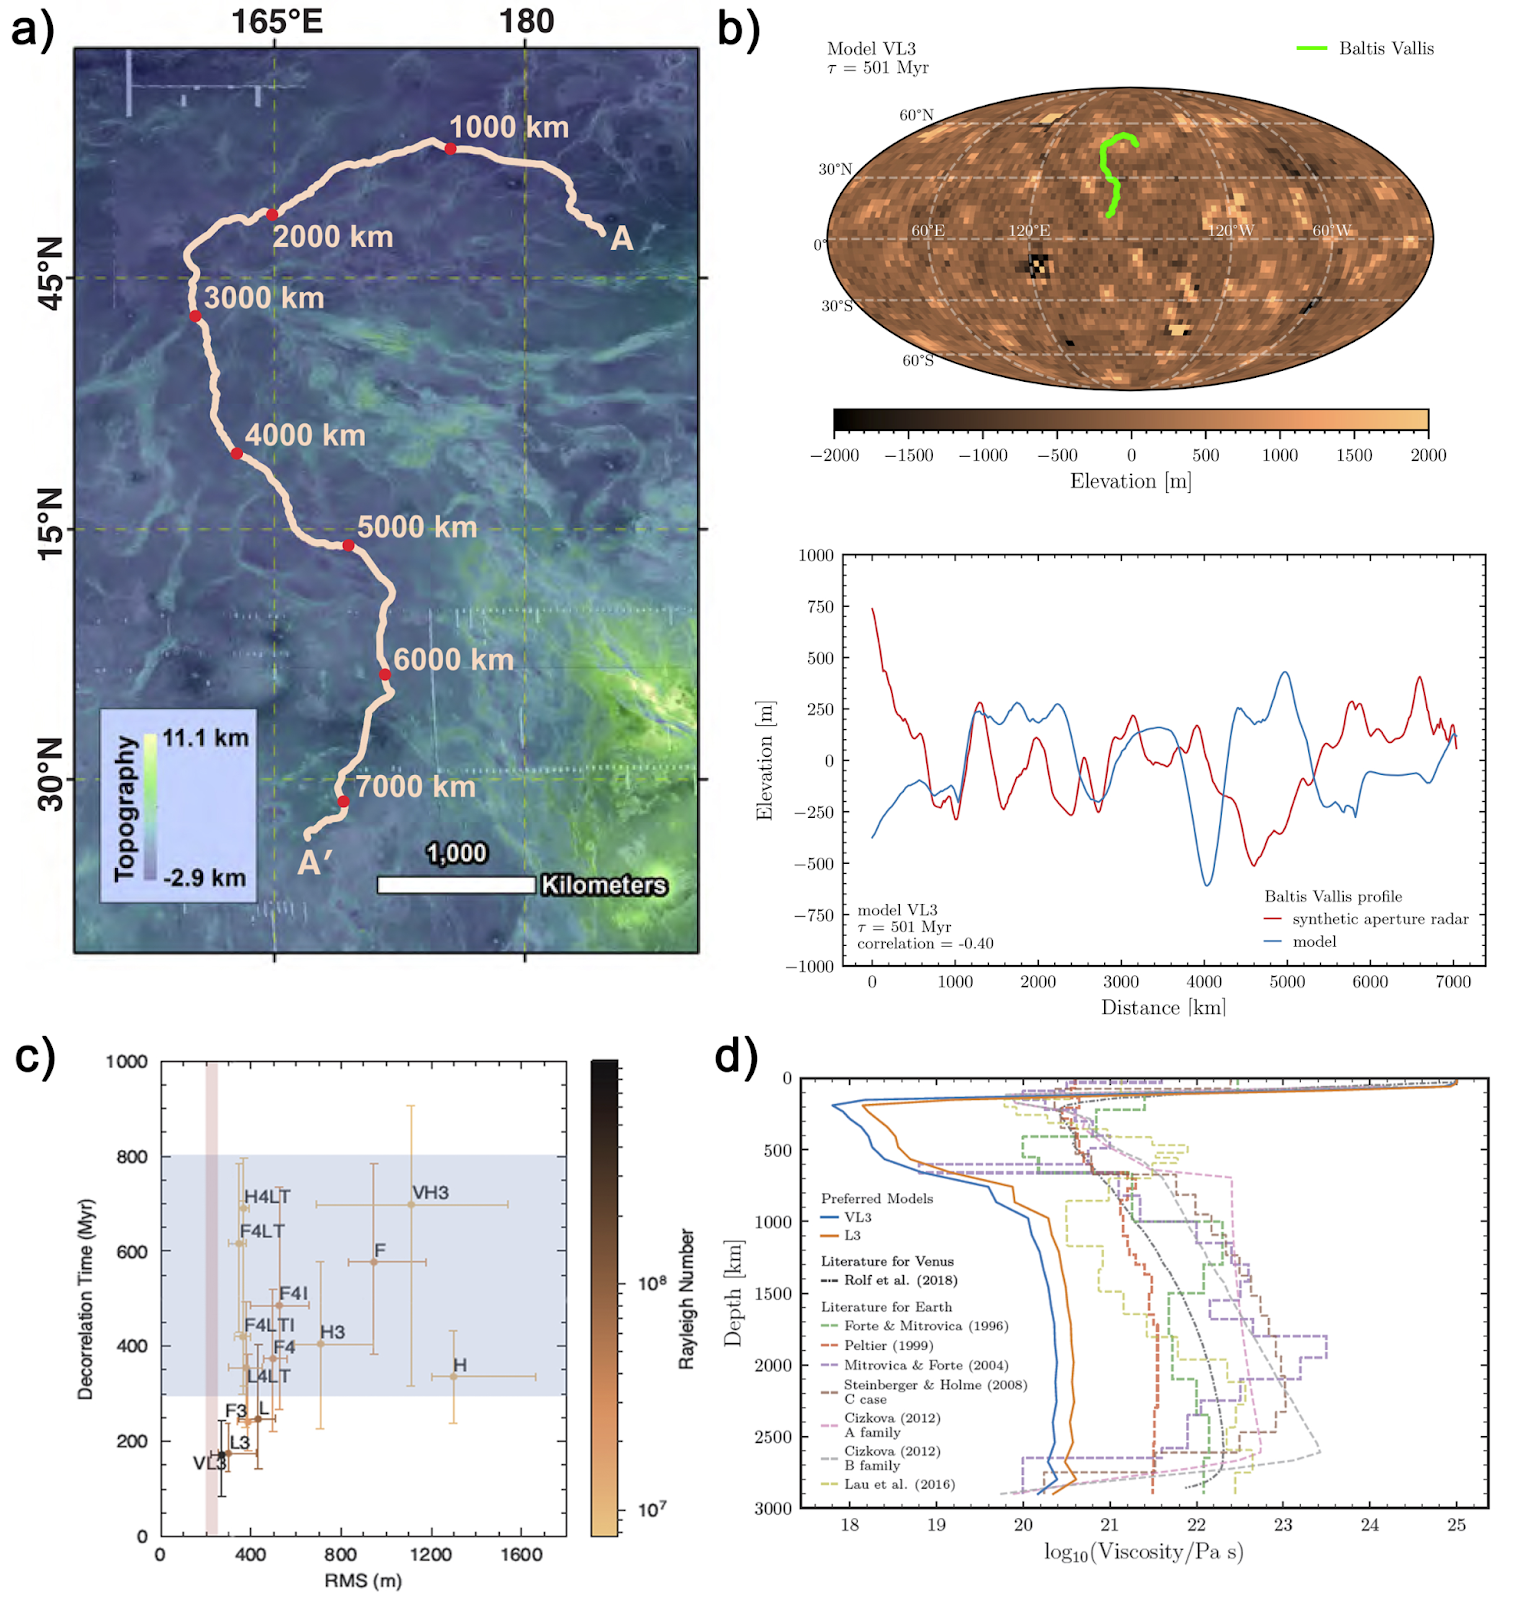
However, Venus is home to some exceptional surface features, when it comes to volcanic/magmatic activity. One such feature is a section of a lava flow so long (about 7000 km long, longer than the Nile river) that it records the length scales and vertical amplitudes of the deformation of the surface: Baltis Vallis (Conrad and Nimmo, 2023; Figure 2a). In fact, according to present-day topography, the lava flow may appear to flow upslope. Naturally, this is due to deformation of the surface of Venus since the Baltis Vallis formation, in a non-physics-defying manner, aka. downslope. It would be foolish not to try and make use of such a remarkable landform.
McGregor et al., (2023) have attempted to capitalize on the properties of Baltis Vallis and investigate what it reveals from the recent state of the venusian mantle. The overarching question was as follows: How does the mantle have to behave, so that the surface of Venus deformed in a way that explains Baltis Vallis?
The authors modelled 3-dimensional simulations (Figure 2b) of the recent evolution of the mantle of Venus in the epoch that spans roughly the age of the surface of the planet (about 300-1000 Myr). Successful simulations were required to match (i) the mean elevation indicated by Baltis Vallis, and (ii) deformation that was quick enough to erase the pre-existing downward slope of the newly formed Baltis Vallis by the time Magellan observations were made (Figure 2c). To account for the arbitrary location of Baltis Vallis relative to the convection cells, its profile is randomly rotated on the sphere and the analysis is repeated for various starting positions and orientations
Overall, the 3D simulations revealed that low mantle viscosities (Figure 2d) were necessary to generate elevations that were too high, and to sufficiently deform the surface between Baltis Vallis formation and present-day. Therefore, the mantle of Venus might be either volatile rich, or, if not water-rich (Constantinou et al., 2024), then likely still be hot compared to Earth. Both plausible states would have deep implications for long-term evolutionary scenarios, including the fate of Venus’ water, the state of its core and ability to generate a magnetic field, and past convection pattern.

Figure 2: a) Topographic map of Baltis Vallis and surrounding area; A is the inferred source and A’ the termination. b) Synthetic topography (upper panel) obtained from the numerical model after 501 Myr. The green track corresponds to one Baltis Vallis profile; thousands of randomly rotated profiles are used to cover the full synthetic topography. The lower panel shows the Baltis Vallis profile alongside the modeled Baltis Vallis topography c) Decorrelation time (time required to deform the original flow) and root-mean-square elevation along the flow are compared to Baltis Vallis elevation (red) and the age of the surface of Venus (blue) for models with different mantle viscosity. Model VL3 is the closest to observation and features a reference viscosity of 1019 Pa.s. d) Radial mantle viscosity profiles for best cases simulations (VL3, L3) compared to estimated profiles for Earth and Venus.
Outlook into the decade of Venus
These two examples of numerical Venus studies focus on mantle convection and surface tectonics, but numerous other studies in recent years have explored different aspects of the planet, such as its atmospheric dynamics, evolutionary history, and formation. Collectively, these models have significantly enhanced our understanding of Venus despite the limited observational data available. Fortunately, a number of missions are set to explore Venus in the coming decade, reflecting a renewed interest in our neighboring planet, with scientists coining the term ‘the decade of Venus’.
No less than three missions are confirmed. NASA’s DAVINCI aims to study Venus’ atmosphere with an orbiter and a descent probe, analyzing its composition and capturing surface images. Another NASA mission, VERITAS, will utilize high-resolution radar mapping to examine Venus’ geological history and surface composition, providing detailed topographic data to enhance our understanding of tectonic processes. The European Space Agency’s EnVision mission will complement these efforts by conducting radar and atmospheric studies, offering valuable comparisons between the evolutionary paths of Venus and Earth. Meanwhile, India’s space agency ISRO prepares to investigate Venus’ atmosphere and surface using radar and spectrometers, in what will be India’s first mission to the planet. Additionally, China has recently directed its efforts toward a Venus atmosphere sample return mission. Finally, Russia plans to return to Venus exploration with Venera-D, an orbiter and lander mission that will study the planet’s surface and atmosphere.
Our models, along with those from other researchers, are generating a wide range of predictions that will soon be tested against observations from these upcoming missions. These comparisons will help refine our understanding of Venus’ interior composition and structure, offering crucial insights into the fundamental differences between Earth and Venus.
References:

Armann, M., Tackley, P.J. Simulating the thermochemical magmatic and tectonic evolution of Venus’s mantle and lithosphere: two-dimensional models. J. Geophys. Res. 117 (E12), E12003, (2012).

Conrad, J. W., & Nimmo, F. (2023). Constraining characteristic morphological wavelengths for Venus using Baltis Vallis. Geophysical Research Letters, 50(10), e2022GL101268.

Constantinou, T., Shorttle, O., & Rimmer, P. B. (2024). A dry Venusian interior constrained by atmospheric chemistry. Nature Astronomy, 1-10.

Herrick, R. R., & Phillips, R. J. (1992). Geological correlations with the interior density structure of Venus. Journal of Geophysical Research: Planets, 97(E10), 16017-16034.

McGregor, N., Nimmo, F., Gillmann, C., Golabek, G., Plattner, A., & Conrad, J. (2023, May). Constraining Venus' convection regime from Baltis Vallis topography. In EGU General Assembly Conference Abstracts (pp. EGU-9783).

Rolf, T., Steinberger, B., Sruthi, U., & Werner, S. C. (2018). Inferences on the mantle viscosity structure and the post-overturn evolutionary state of Venus. Icarus, 313, 107-123.

Shah, O., Helled, R., Alibert, Y. and Mezger, K. Possible chemical composition and interior structure models of Venus inferred from numerical modelling. The Astrophysical Journal, 926(2), (2022).

Tackley, P.J. Modelling compressible mantle convection with large viscosity contrasts in a three-dimensional spherical shell using the yin-yang grid. Phys. Earth Planet. Inter. 171 (1–4), 7–18, (2008).


