Visualisation tools play a crucial role in communicating science as well as raising awareness among a wider audience. They enable us to see, experience and understand the earthly processes taking place in our numerical models and see how relatable they are to the reality. In particular, rendering a model consists to find the best way to use graphical computation to visualise your model and communicate it to a specific audience so they can engage with it and get the maximum experience out of it. This in order to grasp the complexity of natural systems. In this post, I will briefly introduce some of the most interesting rendering tools I have come across.

Michaël Pons. Contact me by email or follow me on twitter @MichaPons.
I will discuss the pros and cons of three tools and present a few examples. The first one is Paraview which uses openGL (Open Graphic Library) to render numerical models. The second is WebGL (Web Graphic Library) which can help anyone access the visualization of these models without involving the additional installation of software and my latest favorite, which I’ve started using more recently, is Unreal Engine which allows you to go a step further in rendering numerical models, and potentially producing photo-elastic 3D images.
ParaView is one of the most widely used visualisation tools. It is a free and open-source software, as it can visualise multiple data formats vtu, vtk, hdf … it’s an ideal tool for visualising voluminous datasets produced by the computation of large numerical models. It offers an ideal solution for interacting with and post-processing data. Users can develop their own plugins in python and state files (sort of ‘templates’) that can be reused with other models to automate some rendering tasks. Manipulating data points to applying specialized filters might be overwhelming for beginners but the extensive default toolset allows for a diverse range of visual outputs. Paraview uses the openGL library to visualise 3D models (Fig. 1) and, although rendering is not Paraview’s main focus, it offers good early options using both CPus (Central processing units) and GPus (Graphics processing units) capabilities. Paraview is able to use ray-tracing to approximate the realism of materials and textures. One drawback of this software is that the visualisation of large datasets requires powerful hardware and graphics capabilities. Moreover, having to depend on the installation of a software to visualise a model might as well limit the accessibility to many people.
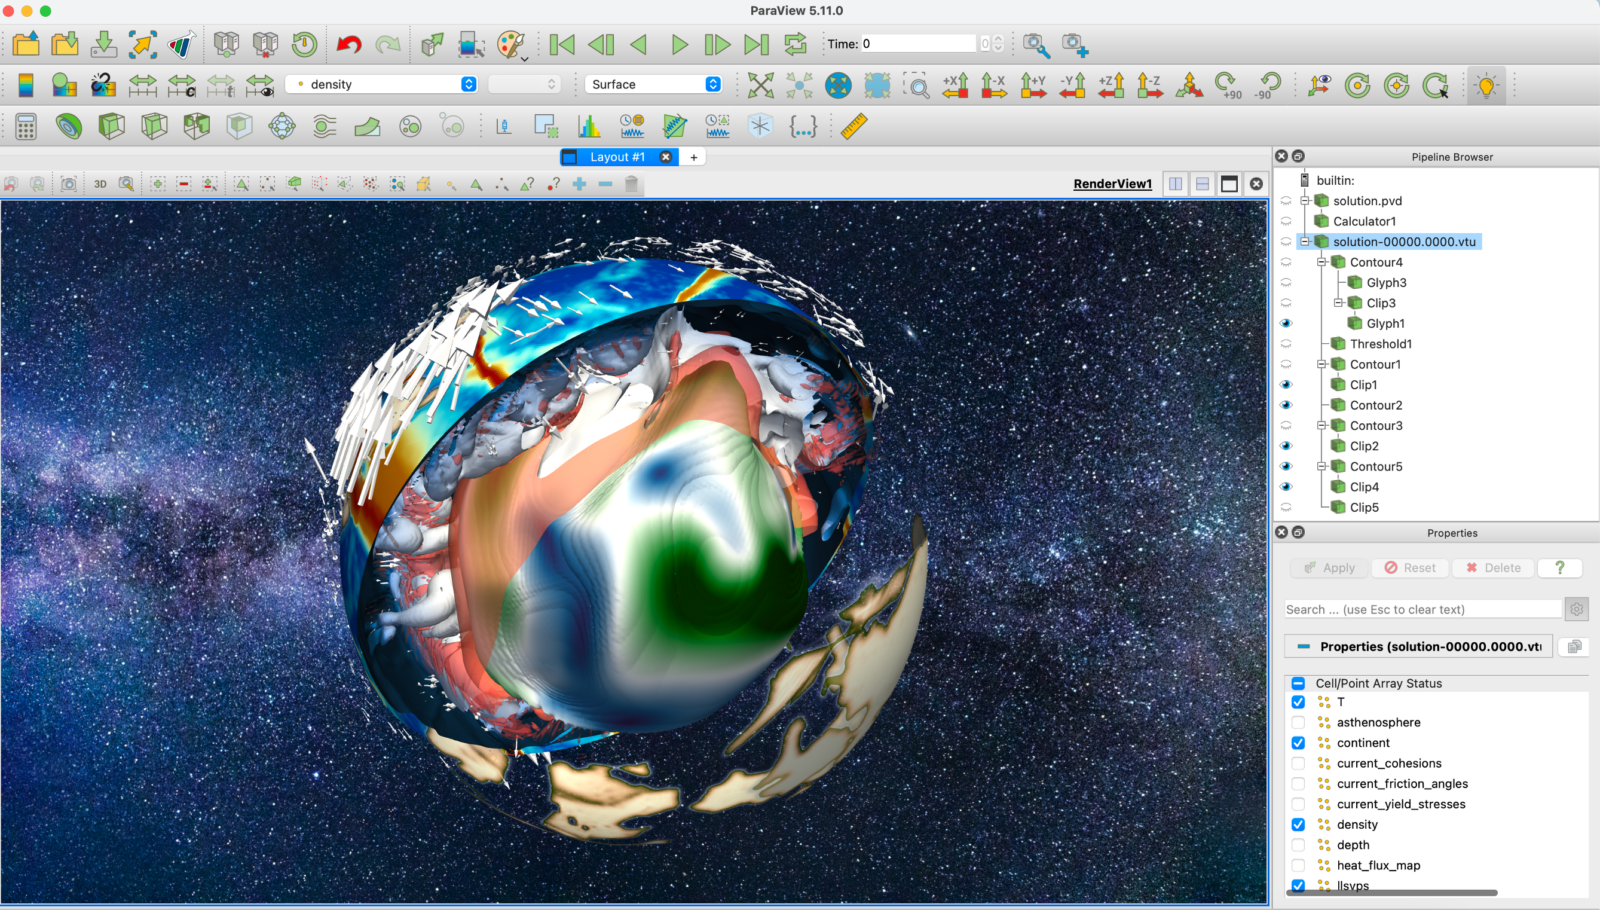 Figure 1 : Visualisation of a 3D geodynamic global scale model made with ASPECT and rendered using Paraview.
WebGL offers a work around with the possibility to visualise your data from a model data stored on a server (e.g. Github) directly on a web browser thanks to its javascript library. The visualisation and processing operate using your own GPus. For example, a user can directly access the data online and visualise them in an interactive manner on a website using custom filters and rendering, which are pre-set by the developer. Paraview actually offers the possibility of exporting your model as .vtkjs format so they can directly be readable by webGL. The function of Paraview for visualisation can also be directly integrated to your own website using the paraviewweb API (Application Programming Interface). Therefore, webGL offers a really versatile way to share your data and visualise them with a broader audience from a website without the need of downloading a software. I have myself played with Three.js which is a 3D javascript library that makes use of the webGL capacities to visualise data in 3D on a personal website which is still in development (Fig. 2). WebGL has opened up the world of 3D graphics to the vast expanse of the internet. With it, geodynamic models can be made accessible to anyone with a web browser, breaking down barriers. WebGL smoothly integrates with various web libraries, making it versatile for different web platforms. Whether it’s a high-end workstation or a tablet, WebGL ensures your visualisation is accessible. However, while versatile, browsers can limit the complexity and depth of visualisations. On the developer side, knowledge in web development is crucial to harness its full potential.
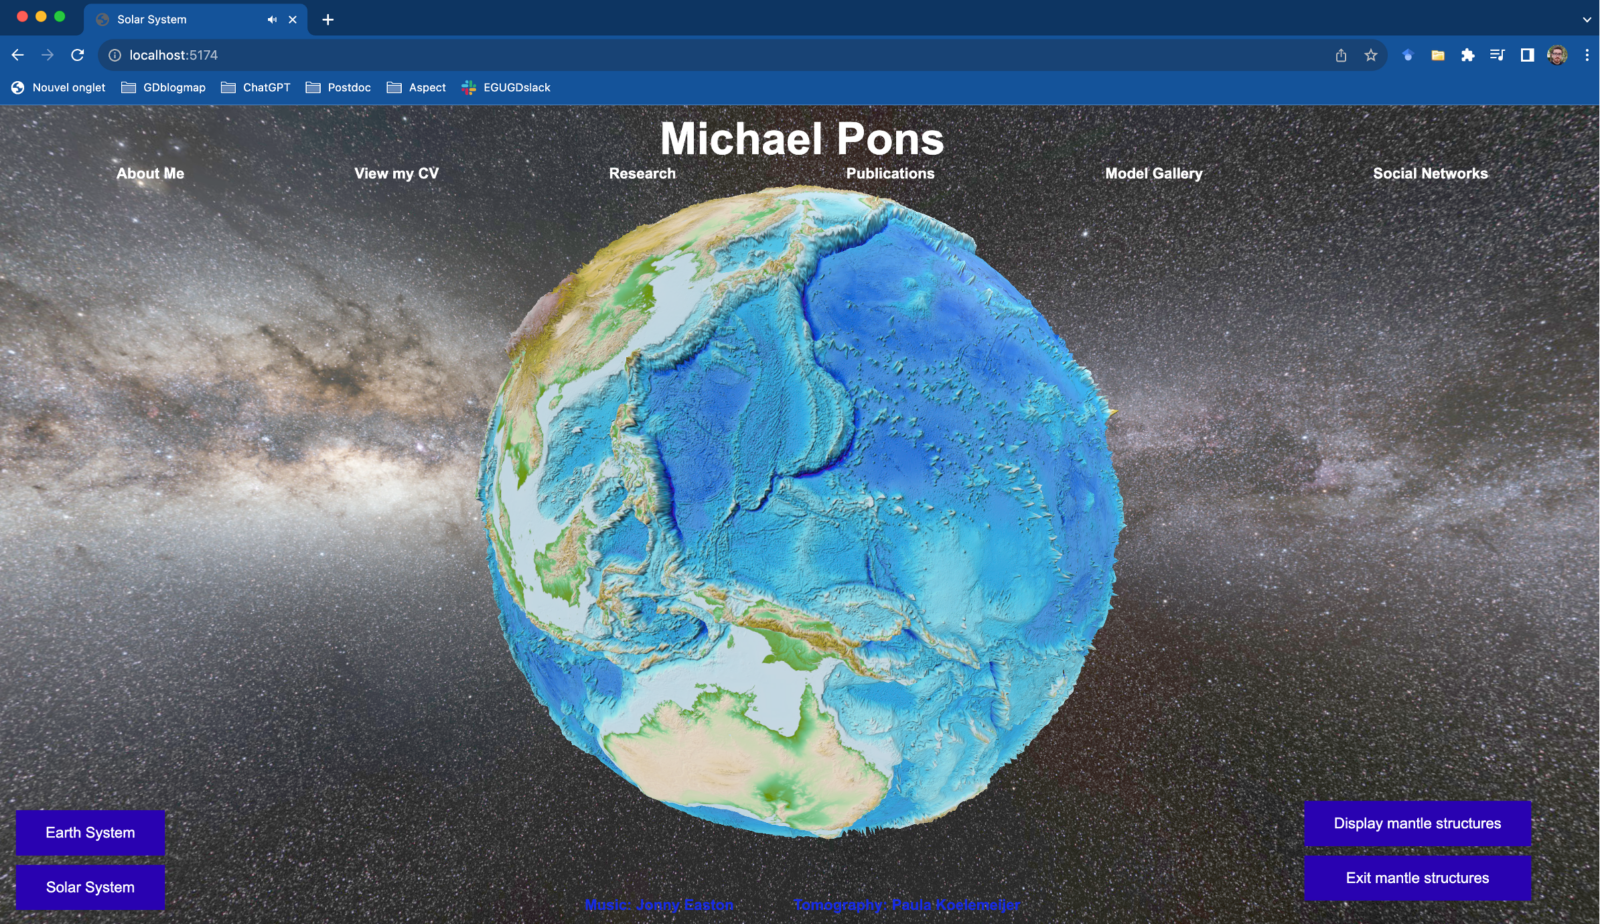 Figure 2 : Picture of a website in development using Three.js, a webGL based library.
Before discussing the last tool, I would like to mention that other visualisation and/or data analysis software making a great job also exist which make use of openGL for volume rendering such as Blender or VisIt.
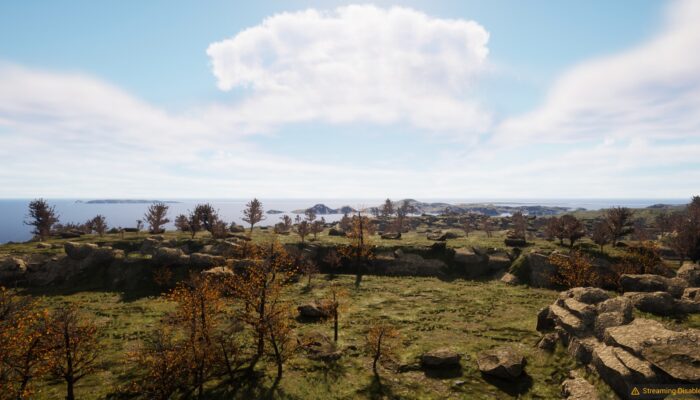
Finally, my last favorite rendering tool is Unreal Engine. Although best known for game development, this software offers a wide range of tools for photorealistic rendering. Its primary design for gaming means geoscientific visualisations may require additional tweaks and adjustments. Depending on the format of your model data, you may need to go through an extra step to convert it so that it can be read by the unreal engine. The software reads .obj and .fbx formats, which can also be exported from Paraview. Model rendering can become a truly immersive experience thanks to the software’s gaming root. For example, the developer can create an interactive environment, offering users an exploratory experience. Manipulating the software may prove rather difficult at first, but once a beautiful rendering is achieved, the experience becomes truly rewarding. Such a platform has great potential for popularisation and could be used in the future for gamification purposes.
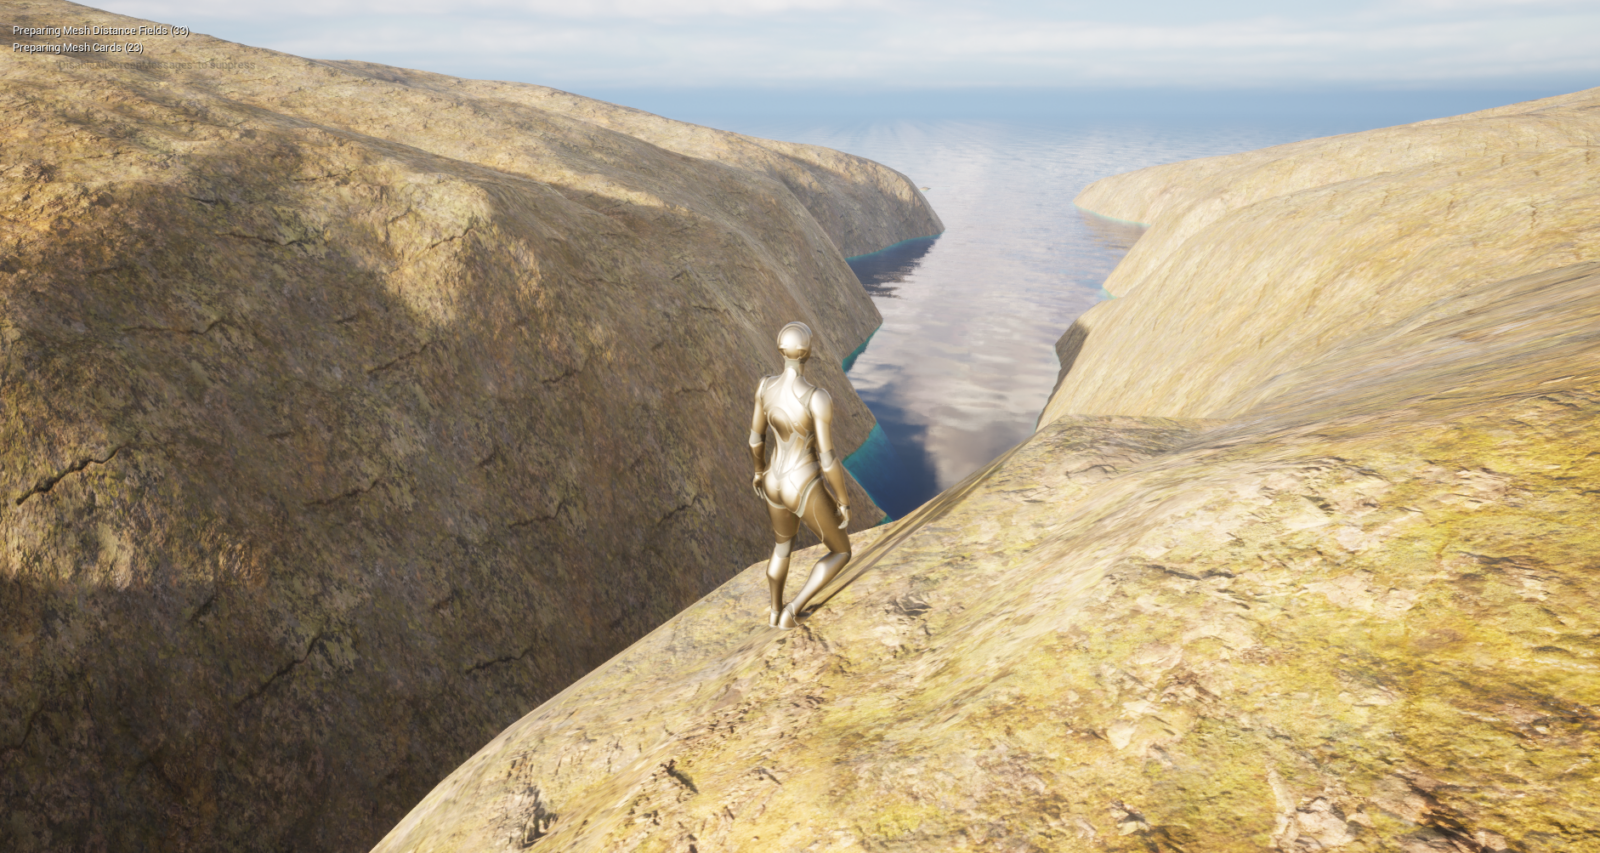
Figure 3 : Illustration of an immersive glacial erosion model using Unreal Engine (Credit: Maxime Bernard).
In summary, these visualization and rendering tools can be the bridge between raw, often unintelligible data to impactful insights that can inform decisions, spark curiosity, and foster understanding. Here’s why impactful visuals are more than just ‘nice-to-have’. A well-crafted visual can communicate across cultural and language barriers, ensuring wider reach and comprehension. Geodynamic numerical models can be quite complex because they deal with the intricate forces and processes that shape our world. For this reason, we require visualization tools that are not only technically proficient but also provide insights into the story of the Earth. This can be achieved using efficient rendering tools which can help us with their interpretation. Whether you prefer the scientific precision of ParaView, the universal accessibility of WebGL or the narrative power of Unreal Engine photo-realistic rendering. It’s all about making the invisible visible and the complex comprehensible.
NB: Let us know in the comments section If you like this type of article and would like to know more about data visualisation and analysis, we might consider publishing blog post tutorials in the future.


Jeroen van Hunen
Hi Michaël,
I really like this blog, very informative. I also wonder if there is scope to follow up this information with a session/short course at EGU.
Many thanks,
Jeroen van Hunen
Michael
Hi Jeroen,
that would be a great idea! I have talked to Constanza Rodriguez Piceda (seismology/geodynamics) and Maxime Bernard (geomorphology) with whom I have worked on visualising some models and who would also like to participate so we could discuss the tools and their use in a short couse. I will discuss with them further and we will probably submit an abstract before the deadline.
Thank you very much. all the best,
Michael