Nowadays geodynamics can involve a lot of 3D data which has to be analyzed. This week Oliver Kreylos, a researcher with the UC Davis W.M. Keck Center for Active Visualization in the Earth Sciences (KeckCAVES) and the UC Davis DataLab, shows us an alternative to looking at 3D data or models on a 2D screen: looking at them in full 3D through virtual reality!
One problem in studying Earth’s deep interior, either via numerical simulation or observational methods such as seismic tomography, is that the resulting data sets are large, complex, and difficult to analyze. Visualization is a proven effective approach to gaining insight from complex data, but visualizing three-dimensional data using two-dimensional display media such as computer screens has inherent issues: projecting 3D data into 2D necessarily causes distortions of relative positions, lengths/distances, and angles. In turn, these distortions can hide important features or relationships between features, or create spurious features or relationships.
Immersive / Virtual Reality Visualization
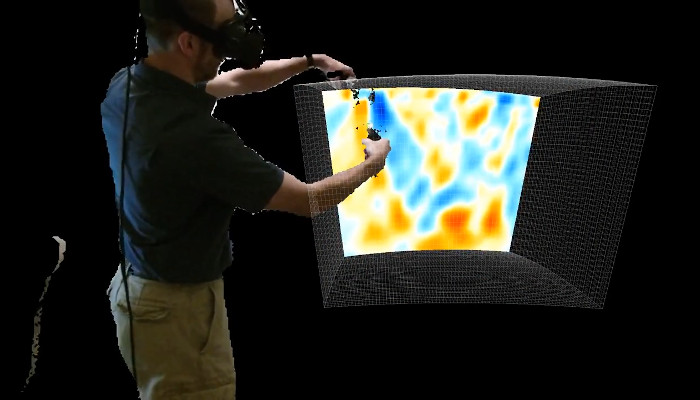
Immersive or virtual reality (VR) visualization solves this problem by visualizing 3D data in a 3D display medium, and therefore avoiding projection to 2D and its concomitant distortions. In VR, virtual 3D objects, including graphical representations of 3D data, appear to the viewer exactly as real 3D objects would, allowing viewers to use the full power of their visual perception for data analysis. Video 1 shows a real-life example of such a “pseudo-holographic” display, and video 2 explains how the illusion shown in video 1 is created by simulating how our eyes and brains perceive the real three-dimensional world around us.
Video 1: Display and interaction in a CAVE virtual reality environment, filmed using a hand-held video camera.
Video 2: The principles of virtual reality perception.
A second, and arguably as important, benefit of VR visualization is that VR allows users to interact with 3D objects or graphical representations of 3D data in intuitive and efficient ways. Interactive visualization, i.e., visualization where users control the representation and display of their data with real-time feedback, has proven to be more effective for data analysis than viewing static images. However, when using “traditional” computers with 2D screens and mouse and keyboard input devices, interaction is also limited to two dimensions. VR, on the other hand, offers 3D input devices that allow users to interact with virtual 3D objects in the same way as they would manipulate real 3D objects with their hands. This combination of projection-less “pseudo-holographic” 3D display and 3D interaction with real-time feedback has proven to be a highly effective medium for analysis of complex 3D data (Kellogg, 2008).
Interactive VR visualization has been used successfully for decades, but only the recent emergence of high-quality low-cost consumer VR hardware such as Oculus Rift or HTC Vive has made it a practical option for a wide audience. Using visualization software (Kreylos, 2008; Billen et al. 2008) developed at the UC Davis W.M. Keck Center for Active Visualization in the Earth Sciences (KeckCAVES) and computer/VR hardware available from mainstream (online) retailers, non-expert users can now purchase their own complete VR visualization systems (headset + capable computer) starting at less than USD 2,000.
3D Visualizer
3D Visualizer is an interactive virtual reality visualization application for 3D gridded data developed at KeckCAVES. It has been used to analyze results from numerical simulations of mantle convection, plate tectonics, and the geodynamo, and regional or global seismic tomography reconstructions. 3D Visualizer uses common visualization techniques such as color-mapped slices, contour surfaces, or direct volume rendering for 3D scalar data; and arrows, streamlines, and streamline bundles for 3D vector data. 3D Visualizer’s main difference to other 3D visualization software such as Paraview is its focus on direct interaction with real-time feedback. For example, to create a contour surface in other software, one would typically select a scalar variable, and enter the data value for which one wants to extract a contour surface. While that is also possible in 3D Visualizer, its main method to create a contour surface is to touch an arbitrary point inside a 3D data set with an input device, and, by pressing a button on that device, extracting the contour surface that contains that point. While keeping the device button pressed, the user can move the input device, and see the extracted contour surface evolve in real time as it follows the touched seed point. It turns out that observing the behavior of a moving contour surface provides additional insight into the detail structure of a region of a data set that would be difficult to glean from a single or multiple static contour surfaces, while at the same time avoiding the visual clutter that often results from creating multiple surfaces in the same region. 3D Visualizer’s other visualization techniques follow the same paradigm of letting users explore data sets by directly querying them using their hands.
Video 3: 3D Visualizer used to analyze a regional seismic tomography reconstruction. Data courtesy of Dr. Richard Allen, UC Berkeley Seismology lab.
Local and Remote Collaboration
Most science is collaborative, and, following the old adage that two pairs of eyeballs see more than one, visualization applications should therefore be collaborative, too. In the world of 2D media, collaborative visualization is straightforward: two or more users look at the same image on a computer’s display, or at the same printed graph. In virtual reality, on the other hand, effective collaboration requires explicit support. Most importantly, head-mounted VR systems can by their nature not be shared by multiple users. In addition, even if multiple VR headsets were available in the same space, the headsets obstruct their users’ visions, meaning that users can not see each other, which not only impedes collaboration, but also poses the danger of users bumping into or hitting each other.
To address these issues, KeckCAVES is developing a collaboration framework shared by all KeckCAVES applications, including 3D Visualizer. Its fundamental idea is to create shared virtual spaces, where users can come together to jointly work with and analyze shared data sets. When entering such a shared space, users not only see he shared data, but also virtual representations (avatars) of each other. Any changes to the shared data or its representation, such as creation of a new contour surface, are immediately shared between all users as well. When connecting multiple VR systems in the same place, the system ensures that users’ avatars in the virtual space precisely line up with their real bodies, allowing for safe collaboration.
By extension, this framework also supports remote collaboration, where users are in different locations, such as working from their own offices. Users see each others’ avatars as before, but can now talk to each other via a built-in VoIP system, see video 4.
Video 4: Remote collaboration between a CAVE, a 3D TV, and a regular desktop computer.
Kreylos, O., Environment-Independent VR Development, in: Bebis, G., et al., "ISVC 2008, Part I," LNCS 5358, Springer-Verlag Berlin Heidelberg, pp. 901-912 (2008)

Billen, M.I., Kreylos, O., Hamann, B., Jadamec, M.A., Kellogg, L.H., Staadt, O., and Sumner, D.Y., A Geoscience Perspective on Immersive 3D Gridded Data Visualization, Computers and Geosciences 34(9), pp. 1056-1072 (2008)

Kellogg, L.H., Bawden, G.W., Bernardin, T., Billen, M., Cowgill, E., Hamann, B., Jadamec, M., Kreylos, O., Staadt, O., and Sumner, D., Interactive Visualization to Advance Earthquake Simulation, Pure and Applied Geophysics 65(3/4), pp. 621-633 (2008)