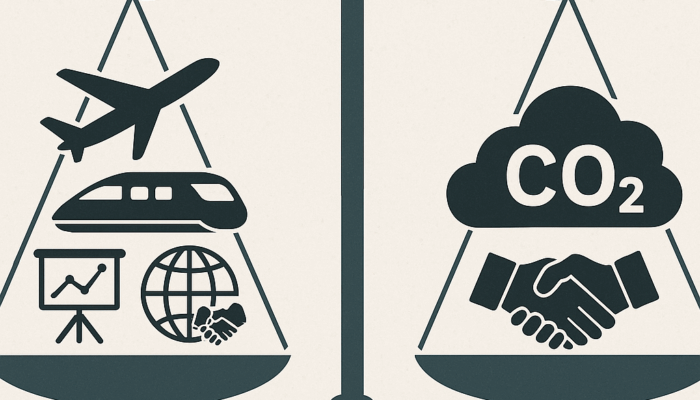
The carbon footprint of scientific collaboration has become an increasingly debated topic. Conferences, workshops, and research travel remain central to how science function, yet they also contribute to global greenhouse gas emissions. Since the pandemic era scientists also learned to work virtually and to attend workshops and conferences online. Understanding the carbon footprint, and how it compares to other global activities, is essential for defining realistic and fair strategies for sustainable science. This is valid not only for scientific conferences but also for major events into different contexts. To give an example of how our scientific activities emit compared to other forms of global mobility. The table below summarizes approximate carbon footprints for a range of large-scale events, spanning scientific, political, cultural, and entertainment contexts.
| Event / Activity | Participants (approx.) | Main Emission Sources | Estimated Carbon Footprint (tCO₂e) |
| EGU General Assembly (Vienna) | ~18,000 | Air and rail travel (~85%), lodging (~5%), venue operations (~10%) | ≈ 18,000–28,000 |
| IPCC Authors Meeting (e.g., Lima) | ~500 | Long-distance flights (~90%), accommodation (~7%), venue operations (~3%) | ≈ 1,100–1,800 |
| Formula 1 Grand Prix (Melbourne) | ~450,000 spectators | Spectator travel (~70%), logistics and teams (~20%), event operations (~10%) | ≈ 200,000–300,000 |
| Paris Fashion Week | ~100,000 attendees | Air travel (designers, buyers, media) (~75%), hotels (~15%), venues and logistics (~10%) | ≈ 100,000–250,000 |
| Presidential USA Tour in Asia | ~500 (staff, press, officials) | Aircraft (~80%), ground logistics and security (~15%), accommodation (~5%) | ≈ 2,000-6,000 |
For the EGU General Assembly, the greatest conference in the context of Earth Sciences in Europe, annually hosted in Vienna during April or May, estimates from the Conference Carbon Tracker initiative indicate a footprint of about 22,300 tons of CO2 (tCO₂e) in 2019 for ~16,000 participants. Scaling to ~18,000 participants and reasonably accounting for a modal mix of roughly one-third from overseas (~2.5 tCO₂e each), one-quarter by train (~0.05 tCO₂e), and the rest flying within Europe (~0.5 tCO₂e) gives a total in the 18,000–28,000 tCO₂e range. Studies of international academic conferences converge on similar values: travel typically represents 75–95 % of total emissions. Warner et al. (2025) found that air travel accounted for 80–96 % of emissions in conferences across disciplines. Comparable findings appear in The Carbon Footprint of Travelling to International Academic Conferences and Options to Reduce It (Jackle,2021). The EGU footprint is well below a single Paris Fashion Week when global travel and logistics are included (~100,000–250,000 tCO₂e) and far below a Formula 1 Grand Prix (~200,000–300,000 tCO₂e). High-level political tours, such as a U.S. presidential visit to Asia, are typically ~2,000–6,000 tCO₂e, i.e. within the range of a mid-sized scientific meeting, while IPCC authors’ meetings (a few hundred participants) are ~1,100–1,800 tCO₂e, an order of magnitude below EGU. These values (obtained using multiple ChatBot models such as ChatGPT and DeepSeek) illustrate that the climate cost of scientific collaboration is substantial but not exceptional when viewed against other sectors, and that the purpose and outcomes of these emissions differ profoundly across event types.
The “Nonlinear” effects of reduced activity
One of the main issues to be considered is that the relationship between reducing conference travel and improving the climate impact of science is not necessarily linear. Moderate reductions, such as switching from short flights to trains, can significantly lower emissions without disrupting connectivity. However, beyond a certain threshold of reduced interaction, the collective efficiency of scientific exchange can drop sharply, in what complex-systems scientists might describe as a tipping effect. When in-person meetings decline too far, opportunities for collaboration, interdisciplinary feedback, and mentoring diminish. This can produce nonlinear losses in scientific productivity and in the public visibility of research. In a context where misinformation and anti-science narratives circulate freely, the absence of coordinated scientific presence may amplify these opposing signals. From a nonlinear-dynamics perspective, these feedbacks matter: small changes in participation can cascade into large-scale shifts in how science interacts with society. The effect is asymmetric, reducing travel linearly does not reduce scientific influence linearly. There is a risk of crossing a threshold where scientific communication becomes fragmented, less trusted, and less capable of informing policy.
The social dimension: eco-anxiety and uneven pressures in Early Career Scientists (ECS)
The current pressure within academia to achieve minimal individual carbon footprints has also psychological and social side effects, particularly among early-career geoscientists. Many young researchers report eco-anxiety and the feeling that professional legitimacy now requires a “sober” lifestyle, namely avoiding conferences, reducing technological use, or limiting international exchanges. While such efforts clearly help reduce emissions, they can also limit exposure to diverse ideas, collaborations, and cultures, which are fundamental to science. The unequal ability to travel, depending on funding, geography, or personal conviction, can deepen disparities within the community. A sustainable research system must therefore consider not only the direct carbon benefits of reduced mobility, but also the indirect costs in terms of lost research opportunities, weakened mentoring, and declining international cooperation.
Toward a framework of “carbon investment”
For this reason, it is useful to complement traditional carbon accounting with a notion of carbon investment. The question should not only be how much carbon is emitted, but also what impact those emissions have in terms of scientific cooperation, knowledge transfer, and public communication. A large meeting such as EGU connects thousands of early-career and senior scientists, with a great majority of ECS, often resulting in collaborations that persist for years. When evaluated over the lifetime of resulting research and societal applications, such events likely yield a high “return on carbon investment”. By contrast, activities of comparable or larger footprint — such as global sports and fashion events — primarily promote consumption and visibility without long-term collective benefits. This does not diminish the need for reduction. Many feasible measures exist such as Encouraging train travel for European participants, designing hybrid formats that maintain inclusivity while limiting intercontinental flights, concentrating in-person events on high-impact activities (training, synthesis, interdisciplinary sessions). Objective monitoring and transparent reporting, such as in the open letter by Climactions IPSL to AGU and EGU, remain essential to guide these choices. Quantitative emission estimates show that major scientific conferences have a lower footprint than other global cultural events but are fundamentally different in purpose. From a systems perspective, excessively limiting scientific interaction could produce nonlinear losses in visibility and cooperation, undermining the collective ability to address climate change itself. A balanced approach, namely combining emission monitoring with strategic carbon investment, offers a way forward: minimizing unnecessary emissions while preserving the networked structure that allows science to remain an active, connected driver of societal transformation.
References
- Conference Carbon Tracker – EGU 2019 Footprint: https://github.com/ConferenceCarbonTracker/CarbonFootprintEGU
- Warner et al. (2025). The carbon footprint of travelling to conferences across disciplines. Regional Studies, Regional Science, Taylor & Francis. https://www.tandfonline.com/doi/full/10.1080/21642850.2024.2447454
- Jäckle (2021) The Carbon Footprint of Travelling to International Academic Conferences and Options to Reduce It. https://link.springer.com/chapter/10.1007/978-981-16-4911-0_2
- Open Letter to AGU and EGU on Conference Travel and Carbon Footprint. Climactions IPSL, 2019. https://climactions.ipsl.fr/wp-content/uploads/2019/10/Open_letter_AGU_EGU.pdf