Greenhouse gas emissions from urban waterways Every field scientist knows to never go to the field without ample supplies of duct tape and cable ties. We utilised this notion daily within the University of Bristol’s Watershed Carbon Lab team, as we undertook a 2-year long field campaign across the UK, Europe and China collecting data for our FLF funded ‘Urban Waterways’ project. Rivers are known t ...[Read More]
Low-cost equipment keeps urban waterway greenhouse gas emissions research afloat
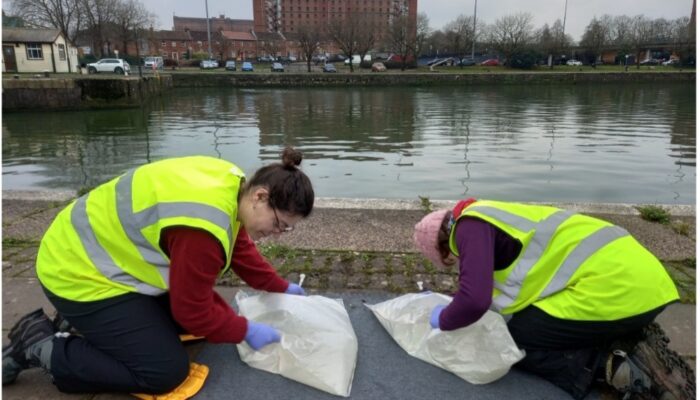
Shaking wine bags to collect methane gas within a scrubbed headspace