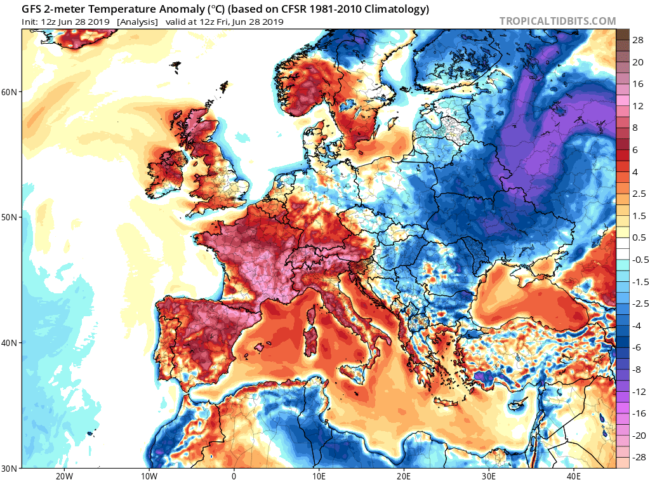
If August Rodin had lived nowadays, he would have placed his gates of hell (la Porte de l’Enfer) in Gallargues-le-Montueux, where the absolute French temperature record (45.9 °C) was set on June 28th this year.
The last week of June has been very hot, not only in the south of France, but overall central Europe: in the Alps, some locations such as Chamonix (France) and Aosta (Italy) experienced temperatures close or above 40°C, setting absolute records. The atmospheric circulation responsible for this event consisted of a marked low pressure system centered on the Atlantic Ocean between France and Spain and a high pressure ridge extending from Morocco and Algeria up to central France and the Alpine regions. The strong Meridional wind caused exceptionally warm air advection from Africa and loads of Saharan dusts.
June heatwaves can have a large impact on professional and educational activities compared to July and August heatwaves, where most of the people are on holiday. It is therefore important to understand if greenhouse emissions have affected the intensity of such event and if similar heatwaves will be more likely in the future. A branch of climate science, termed attribution, tries to provide these answers via European collaborative projects (e.g. EUPHEME). The June 2019 heatwave is very interesting from this point of view because a quick attribution study has been published, at a record time, just few days after the events.
The first step for attributing the event to climate change is to provide its definition: which variable/indicator? Which spatial area? Which period of time? In their study the authors considered the three-day average of daily mean temperatures, as they are relevant for health impacts, and two spatial scales: the whole of France and one city, Toulouse. Only June heatwaves were analyzed because the atmospheric circulation is generally different in June than in July and August and the impacts are also different.
The study used a combination of high resolution observations and state-of-the-art climate models to highlight that the probability of this event has largely increased compared to the past and that similar events will be more likely in the future. The authors found that this event is about 4°C warmer than a century ago. They have however also recognized that the quantification of the increase in probability of this event under climate change strongly depends on the models/observations considered. They pointed out to the inadequacy of current models at simulating these events. This poses serious challenges both for the scientific community as well as for the decision makers: on one side, new techniques should be developed to improve the representation of extreme events in climate models. The non-linear geophysics community strongly contributes to this task by proposing bias correction algorithms to improve models output, and techniques issued from dynamical systems theory or statistical mechanics to simulate heatwaves with large deviations. On the other side, decision makers should be aware that uncertainty is a key feature of these studies and take action to prevent the worst possible scenarios both with adaption strategies (heat plans) and by reducing greenhouse gases emissions.