The Lutz Creek watershed, administered by the Smithsonian Tropical Research Institute (STRI) on Barro Colorado Island (BCI), is one of the longest continually monitored, micro-catchments in the neotropics. This catchment is central to the long-term climate and hydrological monitoring program that STRI has operated on BCI since 1972. The information derived from this program plays an essential role in supporting the research that has been carried out by thousands of researchers and students during the last 50 years (https://stri.si.edu/bibliography-search).
Barro Colorado Island
BCI was formed by the creation of Lake Gatun in 1913 during the construction of the Panama Canal. The 15-square-kilometer island is home to one of the oldest tropical research stations in the world and where research has been carried out for more than 100 years. The Smithsonian Tropical Research Institute (STRI ) was created as a unit within the Smithsonian to administer and facilitate research on BCI, and later at research stations throughout the Republic of Panama.

Location of Barro Colorado Island and the Lutz Catchment
BCI ranges in elevation from 26m asl to 167 m asl, is fully forested, with what has been characterized as a lowland seasonal tropical forest, with a mix of deciduous and evergreen trees. The highest part of the island is a gentle plateau. BCI is one of the most intensively studied area of the global tropics because of the century-long presence of a research station and ongoing scientific investigation focused mainly on terrestrial forest ecology, entomology, animal behavior and related fields. Forests on BCI are aging, reflecting a complex land-use history in which local-scale agriculture was practiced until the early 20th century.
BCI climate has a tropical maritime climate with pronounced wet (May-Dec) and dry (Jan-April) seasons and little variation in monthly average temperatures throughout the year. Year-to-year and decade-to-decade precipitation is highly variable.
The ENSO El Niño/La Niña cycle has major effects on short-term (months to years) fluctuations. El Niño events are strongly associated with dry years with almost all of the driest years (1972, 1987/9, 1997/8, 2015/6) recorded during the strongest El Niño events. Likewise, La Niña events are often associated (although less strongly) with wet years. Decadal-length fluctuations are correlated with both Pacific and Atlantic oceanic oscillations.

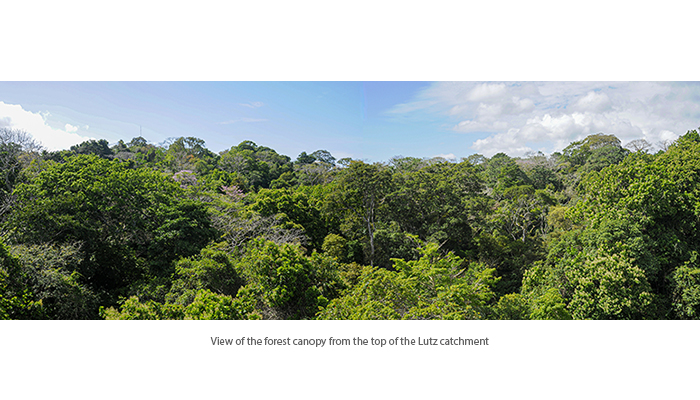
Aerial view of the Lutz catchment
Average yearly precipitation is 2,645 mm (± 490 SD) and ranges between 1,699 and 4,487 mm. Average dry season precipitation is 143mm (± 229 SD) while average wet season precipitation is 2,522mm (± 424 SD).
Yearly average temperature at canopy height is 25.9C (± 0.5 SD). Monthly average temperatures range from 25.2 C to 26.6 C. Since 1972, data from BCI show a significant increase in temperatures: over 2C in nighttime minimum temperatures and 1C in maximum temperatures.
Estimated evapotranspiration averages 3.6mm/day (± 0.3 SD) – 5.2mm/day during the dry season and 2.8mm/day during the rainy season. Average yearly estimated evapotranspiration is 1307mm (± 123 SD) .
The Lutz Catchment Monitoring Program

Topographic map of the Lutz catchment showing soil moisture sampling locations (contour interval is 2m)
The Lutz Catchment hydrological study site is located on the Northeastern slopes of BCI, located in the middle of Gatun Lake in the central part of the Republic of Panama (weir at 9° 09′ 42.8358″ N, 79° 50′ 15.6699″ W).
The watershed is underlain by Oligocene tuffaceous and fossiliferous sandstone bedrock, rich in calcite, and clay-rich (smectitic) soils overlie a thick saprolite. The size of the Lutz catchment is 9.69 ha. The catchment has steep hillslopes that drain rapidly into the stream and tributaries.
The Lutz Tower Meteorological Tower
The environmental monitoring program at the Lutz catchment consists of a 48m (originally 42m, explanation below) instrumented walk-up tower, a weir, and soil moisture monitoring.

View of the Lutz catchment meteorology tower and sensors
Both the tower and the weir are located near the base of the catchment below where all the tributaries of the Lutz Creek have joined the mainstem.
Sensors on the Lutz tower record temperature, relative humidity, solar radiation, wind speed and direct, and evapotranspiration. Data are collected using two different methods: electro-mechanical (electronic sensors, data loggers, chart recorders, etc.), and manual (rain gauges, max-min thermometers, sling psychrometers, soil samples, etc.) by a technician.
Historically, manual meteorological measurements have shown themselves to be the most accurate over the long-term. Wherever possible, parameters are measured both manually and electronically. The only exceptions to this rule are solar radiation (electronic only), estimated evapotranspiration (manual only), and gravimetric soil moisture (manual only). Electronic sensors record temperature, relative humidity, wind speed and direction and solar radiation every 15-minutes. Precipitation data (daily manual and 5-min interval electronic) are available from a station located 170m from the Lutz tower. Manual measurements are made 3-5 times per week.
Soil moisture has been collected at 10 sites throughout the catchment (see map above) since 1972. These data are obtained by extracting soil moisture samples from two depths at these 10 sites once a week during the dry season and once every two weeks during the rainy season (when soil moisture is almost always close to saturation).
The Lutz Weir

Lutz weir
We calculate runoff by measuring water stage at the Lutz 120° V-notch weir. The weir was built with the help of the US Corps of engineers in 1972 –during the period when the US military operated in Panama. Between 1972 and 1996, stage was recorded using a stilling well, a float, and a Stevens paper chart recorder. The charts were digitized by hand. By the time we discontinued the use of the chart recorder, over 1.5km of charts had been created and digitized. In 1996 an ISCO 3230 Bubbler Flow Meter was installed and programmed to record weir stage at 5-minute intervals. In 2014 the ISCO was replaced by a Sutron Radar system.
Despite the many difficulties in operating electronic equipment in the tropics, i.e. tree falls, numerous insect species that build nests in and around buildings and equipment, major storms, an invasion by US troops, and a global pandemic, the runoff record for this weir is over 99% complete. We believe that is one of the longest, most complete micro-catchment run-off datasets in the neotropics.

Monthly Lutz catchment runoff (converted to mm equivalent)
Hydrologically, the Lutz catchment is ‘flashy’ with peak runoff following peak rainfall intensity by as little as 15 minutes, due primarily to the steep slopes of the catchment. On average, 34% of recorded precipitation drains through the weir – ranging between 16 and 53%. Most of the remainder is lost through evaporation, however a small, but unknown amount is likely lost through filtration into the underlying substrate.
We remove the sediment that collects above the weir once a year in the middle of the dry season when runoff is zero or close to zero. The amount of sediment that is removed each year is recorded to provide a rough estimate of bedload transport in the catchment.
We collect gravimetric soil moisture samples at ten locations throughout the catchment by taking weekly (December-May) or biweekly (June-November) soil samples at two depth at each sample location.
The Trials and Tribulations of Working in the Tropics
Operating a climate monitoring program in the middle of a tropical forest presents multiple challenges, even in the absence of global-pandemic-related, work shutdowns. The extreme humidity of the BCI forest is very hard on sensors, either directly through the presence of precipitation or condensation throughout much of the year at the level of the forest floor, or, additionally, this moisture promotes the growth of innumerable mold and algae species. Many electronic sensors have not been designed with these conditions in mind, which makes producing reliable data a constant challenge.
The greatest problems are the result of the very forest that the monitoring program is designed to characterize. The forest in the Lutz catchment is almost entirely secondary growth. Almost all trees on the Lutz side of BCI where cut down during the construction of the Panama Canal between 1880 and 1914. As a result, the trees at the Lutz catchment are still growing taller. When the Lutz tower was built, the canopy was well below the top of the 42m top of the Lutz tower. By the early 2000’s the canopy had grown almost equal to the top of the tower and it was necessary to add new sections to the tower to increase it to the current 48m. As the trees continue to grow, they appear to be less well anchored to the soils.

2018 Tree gap near the Lutz tower
Treefalls are more frequent in the catchment and the possibility that one of these tree falls should hit either the tower itself or the guy wires that help stabilize the tower has been gradually increasing. In May of 2018 an almost worst-case scenario occurred when a large tree fell and damaged several guy wires. While the tower did not collapse, it was sufficiently warped to make climbing the tower to carry out the daily manual measurement too risky.
The large clearing created by the tree fall (see picture) will certainly have modified the local microclimate in ways that have yet to be characterized.
Data Availability
We make all data collected at the Lutz catchment freely available on the project’s website https://biogeodb.stri.si.edu/physical_monitoring/research/barrocolorado . This site also provides daily, monthly, and yearly summaries, as well as detailed information about data collection methods.
The Lutz Catchment is only one of nine climate and oceanographic monitoring stations operated by STRI. Data from these stations are likewise available on our website.
The Lutz Creek data have significantly improved our understanding of basic hydrological processes and aided the ongoing research into the complex terrestrial ecosystems of the island and the region. As global climate change continues to alter the climate on BCI, the ability to compare current and past climate and hydrological regimes will prove to be an invaluable resource.