CrowdWater is a citizen science project that enables the collection and sharing of water level data on streams and rivers worldwide using virtual scales. As part of the project, a CrowdWater (CW) mobile application was developed that allows users to take and upload geo-referenced photos of water bodies, which are then processed and stored in a global database. CW data provides valuable information for small and ungauged rivers that are often neglected by conventional monitoring systems.
The amount of data that we are able to gather from this application is surprising. There are currently more than 30,000 observation stations all around the world!
In spring 2022, as part of the European Summer of Weather Code (ESoWC), a program that promotes collaboration among scientists, we developed a machine learning model for flood forecasting using CrowdWater data. Our project, called “Flood forecasting: the power of citizen science”, aims to improve the reliability and robustness of flood prediction for ungauged catchments that are vulnerable to flash floods.
Our approach
The challenge was to develop a machine learning model to analyze CW data, and assess its potential to be used as part of a flood forecasting system.
Our proposed methodology consisted of five key steps:
- data cleansing and selection;
- water level conversion;
- river characterization;
- machine learning model development;
- model evaluation and refinement;
How to translate a virtual scale into the real world?
Converting information from CrowdWater into usable data is not a trivial task. Each CrowdWater spot is first initiated with a picture, on which the photographer puts a virtual scale. Then, any CrowdWater citizen scientist can go back to the same spot, upload a new picture and compare the new water level to the virtual scale from the first picture. However, the virtual scale height can not be easily standardized across all locations.
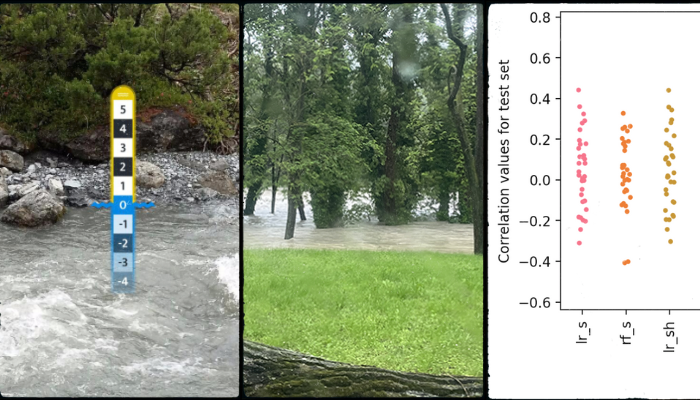
Below are some of the pictures of these water level measurements at different locations.

Virtual scales at high (left), low (center) and medium (right) water levels.
To address the lack of standardization in CW’s virtual scales, we manually standardized each virtual scale by visually estimating its real-world height based on surrounding features. This approach allowed us to convert the qualitative virtual scale readings into quantitative water level measurements (in cm).

Using surroundings to visually estimate the real-life height of a CrowdWater virtual scale!
We then manually calculated the width of each river using Google Maps. We also used digital elevation models for the selected catchment to calculate stream order and catchment area using QGIS.
A first attempt at a simple machine learning model
Machine learning (ML) connects citizen scientists and traditional monitoring stations: CrowdWater data and river gauge observations are used to train a ML model, which will eventually convert photographs into discharge observations. To train the ML model we initially planned to use data from real gauging stations, but unfortunately, there were lots of gaps in the available data. Since we couldn’t use real data, we used the best available proxy: discharge simulations driven by meteorological data from the European Flood Awareness System (EFAS).
We used two different types of models: a random forest model and a linear regression model. For each of the models, we started by just using the water level and the width of the river to predict the EFAS flow. We then included the stream order, the width of the river and the catchment area and observed how the model performed by adding more information.
Below are the training results and the validation results:

Figure 3: Train Results. lr=linear regression; rf=random forest; s=spotted at; h=height; w=width; o=order of the river; a=catchment area.
As we can see, the random forest model overfitted substantially, while linear regression overfitted to a lesser degree. Adding information about stream width and order data to the linear regression model improved the results. The information about the catchment area didn’t quite meet our expectations and it didn’t affect the model results at all.

Validation Results.
During validation all the models worked poorly and overfit. This was likely due to our small sample size. Getting a larger and a more robust set of data would have likely helped us improve the results.
What will the future hold?
Our ESoWC journey highlighted the need for a larger and more robust dataset, which we were not able to obtain during the short time of the project. However, we can focus future efforts on automating the visual inspection of virtual scales through computer vision techniques, on streamlining the integration of real-time CW observations with traditional gauging station data and on exploring more sophisticated machine learning algorithms, such as deep learning models.
With our project we witnessed the potential of CrowdWater datasets, that can give insights into areas with very limited or no observational data. By combining the dedication of citizen scientists with advanced data analysis techniques, we can unlock a new era of real-time flood forecasting, safeguarding communities and promoting sustainable water management practices.