While the first week of COP22 – the climate talks in Marrakech – is coming to an end, the recent election of Donald Trump as the next President of the United States casts doubt over the fate of the Paris Agreement and more generally the global fight against climate change.
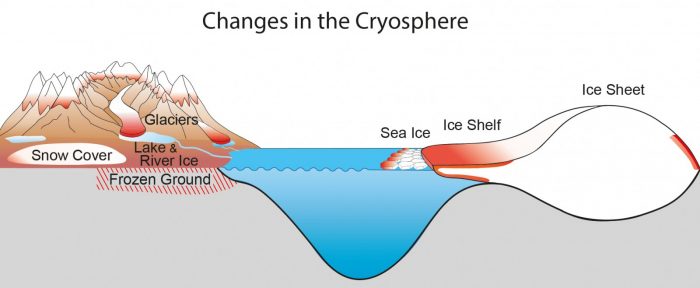
In this new political context, we must not forget about the scientific evidence of climate change! Our figure of the week, today summarises how climate change affects the cryosphere, as exposed in the latest assessment report of the Intergovernmental Panel on Climate Change (IPCC, 2013, chapter 4)
Observed changes in the cryosphere
Glaciers (excluding Greenland and Antarctica)
- Glaciers are the component of the cryosphere that currently contributes the most to sea-level rise.
- Their sea-level contribution has increased since the 1960s. Glaciers around the world contributed to the sea-level rise from 0.76 mm/yr (during the 1993-2009 period) to 0.83 mm/yr (over the 2005-2009 period)
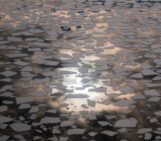
Sea Ice in the Arctic
- sea-ice extent is declining, with a rate of 3.8% /decade (over the 1979-2012 period)
- The extent of thick multiyear ice is shrinking faster, with a rate of 13.5%/decade (over the 1979-2012 period)
- Sea-ice decline sea ice is stronger in summer and autumn
- On average, sea ice thinned by 1.3 – 2.3 m between 1980 and 2008.
Ice Shelves and ice tongues
- Ice shelves of the Antarctic Peninsula have continuously retreated and collapsed
- Some ice tongue and ice shelves are progressively thinning in Antarctica and Greenland.
Ice Sheets
- The Greenland and Antarctic ice sheets have lost mass and contributed to sea-level rise over the last 20 years
- Ice loss of major outlet glaciers in Antarctica and Greenland has accelerated, since the 1990s
Permafrost/Frozen Ground
- Since the early 1980s, permafrost has warmed by up to 2ºC and the active layer – the top layer that thaw in summer and freezes in winter – has thickened by up to 90 cm.
- Since mid 1970s, the southern limit of permafrost (in the Northern Hemisphere) has been moving north.
- Since 1930s, the thickness of the seasonal frozen ground has decreased by 32 cm.
Snow cover
- Snow cover declined between 1967 and 2012 (according to satellite data)
- Largest decreases in June (53%).
Lake and river ice
- The freezing duration has shorten : lake and river freeze up later in autumn and ice breaks up sooner in spring
- delays in autumn freeze-up occur more slowly than advances in spring break-up, though both phenomenons have accelerated in the Northern Hemisphere
Further reading
How much can President Trump impact climate change?
What Trump can—and can’t—do all by himself on climate | Science
US election: Climate scientists react to Donald Trump’s victory | Carbon Brief
Which Trump will govern, the showman or the negotiator? | Climate Home
GeoPolicy: What will a Trump presidency mean for climate change? | Geolog
Previous posts about IPCC reports
Image of the Week — Ice Sheets and Sea Level Rise
Image of the Week — Changes in Snow Cover
Image of the Week — Atmospheric CO2 from ice cores
Image of the Week — Ice Sheets in the Climate
Edited by Emma Smith
![Image of the Week – On thin [Arctic sea] ice](https://blogs.egu.eu/divisions/cr/files/2018/10/kayak-161x141.jpg)
Michel
Nice job summarizing the key numbers from the IPCC report
Pingback: 2016 SkS Weekly Climate Change & Global Warming News Roundup #47 – Enjeux énergies et environnement
Pingback: Cryospheric Sciences | Image of the Week – For each tonne of CO2 emitted, Arctic sea ice shrinks by 3m² in summer
Pingback: Cryospheric Sciences | Image of the Week – The ups and downs of sea ice!
Pingback: Cryospheric Sciences | Ice-hot news: The cryosphere and the 1.5°C target