Context
On the eve of the COP21, it is of paramount importance to recall how strongly the cryosphere is affected by Climate Change. Today, we present the impact of melting ice on sea level rise, as it is presented in the latest assessment report of the Intergovernmental Panel on Climate Change.
Quick facts
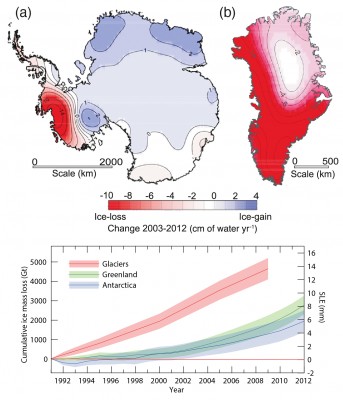
-Since 1992, the Glaciers, Greenland and Antarctic Ice Sheets have risen the sea level by 14, 8 and 6 mm, respectively.
-The Greenland and Antarctic ice losses have accelerated for the last 2 decades.
In Greenland ice-loss rates increased from 34 Gt/yr* (between 1992-2001) to 215 Gt/yr (between 2002-2011), which was caused by more widespread surface melt + run-off and enhanced discharge of outlet glaciers.
While in Antarctica, ice-loss rates “only” rose from 30 Gt/yr (between 1992-2001) to 147 Gt/yr (between 2002-2011), this loss mostly occurred in West Antarctica (Amundsen Sea Sector and Antarctic Peninsula) and was driven by the acceleration of outlet glaciers.
*An ice loss of 100 Gt/yr is approximately 0.28 mm/yr of sea level equivalent
Further Reading
-see Erlend’s post about his incredible run from Pole to Paris to raise awareness about Climate Change and COP21.
Peter Taylor
Hello Sophie! In the Arctic, there was a warm period from 1920-1940 and a cool period from 1950-1985, in line with the oceanic Arctic Oscillation with a period of about 80-90 years. This would mean that a natural peak occurred around 2000-2010 and a decline in temperature would now be expected. North Atlantic sea surface temperatures have already shifted downward over the last 5 years, and Arctic sea-ice recovered slightly from a trough in 2012 (by about 20%). How do we know that current ice-loss is outside of the cyclic natural variability?
Sophie Berger
Hello Peter,
I do agree that sea-ice extent has been fluctuating for the last 150 years but if you look at this figure (from Chapter 4 of the last IPCC report) you can see that, since the 60s, the decrease in sea-ice extent is larger than inter-annual variability and that it is the case for different datasets.
Pingback: Cryospheric Sciences | Sea Level “For Dummies”
Pingback: Cryospheric Sciences | Image of the Week – Climate Change and the Cryosphere