Every year again, the Conference of Parties takes place, an event where politicians and activists from all over the world meet for two weeks to discuss further actions concerning climate change. In the context the COP24, which started this Monday in Katowice (Poland), let’s revisit an important decision made three years ago, during the COP21 in Paris, and its consequences for the state of the cryosphere…
1.5°C target – what’s that again?
Last October, the International Panel on Climate Change (IPCC) released a special report (SR15) on the impacts of a 1.5°C global warming above pre-industrial levels. This target of 1.5°C warming was established during the 21st conference of the parties (COP21), in a document known as the Paris Agreement. In this Agreement, most countries in the World acknowledge that limiting global warming to 1.5°C warming rather than 2°C warming would significantly reduce the risks and impacts of climate change.
But wait, even though achieving this target is possible, which is not our subject today, what does it mean for our beloved cryosphere? And how does 1.5°C warming make a difference compared to the 2°C warming initially discussed during the COP21 and previous COPs?
A reason why the cryosphere is so difficult to grasp is the nonlinear behaviour of its components. What does this mean ? A good basic example is the transition between water and ice. At 99.9°C, you have water. Go down to 0.1°C and the water is colder, but this is still water. Then go down to -0.1°C and you end up with ice. The transition is very sharp and the system can be deeply affected even for a small change in temperature.
As a main conclusion, studies conducted in the context of SR15 show that, below 1.5°C of global warming, most components of the cryosphere will be slightly affected, while above that level of warming, there is more chance that the system may respond quickly to small temperature changes. In this Ice Hot News, we review the main conclusions of the SR15 concerning ice sheets, glaciers, sea ice and permafrost, answering among others the question if achieving the 1.5°C target would prevent us to trigger the potential nonlinear effects affecting some of them.
Ice sheets
The two only remaining ice sheets on Earth cover Greenland and Antarctica. If melted, the Greenland ice sheet could make the sea level rise by 7 m, while the Antarctic ice sheet could make it rise by almost 60 m. A recent review paper (Pattyn et al., 2018), not in SR15 because published very recently, shows that keeping the warming at 1.5°C rather than 2°C really makes the differences in terms of sea level rise contribution by the two ice sheets.
Greenland is a cold place, but not that cold. During the Holocene, the surface of the ice sheet always melted in summer but, in the yearly mean, the ice sheet was in equilibrium because summer melt was compensated by winter accumulation. Since the mid-1990s, Greenland’s atmosphere has warmed by about 5°C in winter and 2°C in summer. The ice sheet is thus currently losing mass from above and its surface lowers down. In the future, if the surface lowers too much, this could accelerate the mass loss because the limit altitude between snow and rainfalls may have been crossed, further accelerating the mass loss. The temperature threshold beyond which this process will occur is about 1.8°C, according to the Pattyn et al., 2018 paper.
Antarctica is a very cold continent, much colder than Greenland, but it has been losing mass since the 1990s as well. There, the source of the retreat is the temperature increase of the ocean. The ocean is in contact with the ice shelves, the seaward extensions of the ice sheet in its margins. The warmer ocean has eroded the ice shelves, making them thinner and less resistant to the ice flow coming from the interior. And if you have read the post about the marine ice sheet instability (MISI), you already know that the ice sheet can discharge a lot of ice to the ocean if the bedrock beneath the ice sheet is deeper inland than it is on the margins (called retrograde). MISI is a potential source of nonlinear acceleration of the ice sheet that, along with other nonlinear effects mentioned in the study, could trigger much larger sea level rise contribution from the Antarctic ice sheet above 2 to 2.7°C.
You can find complementary informations to the Pattyn et al., 2018 paper in SR15, sections 3.3.9, 3.5.2.5, 3.6.3.2 and in FAQ 3.1.
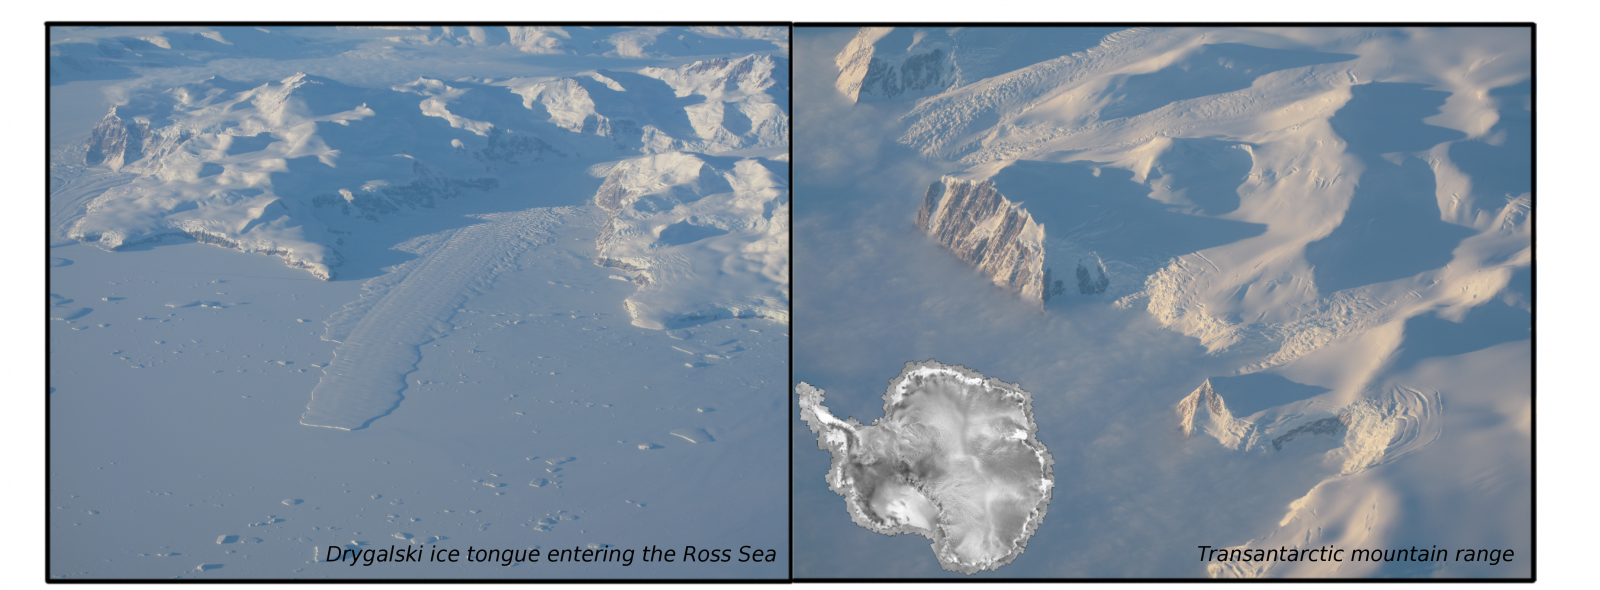
Glaciers crossing the transantarctic mountains, one of them ending up to Drygalski ice tongue (left side) in the Ross sea. The ice tongue is an example of those ice shelves that form as grounded ice flows toward the sea from the interior. Ice shelves are weakened by a warmer ocean, which accelerates upstream ice flow [Credit: C. Ritz, PEV/PNRA]
Glaciers
Over the whole globe, the mass of glaciers has decreased since pre-industrial times in 1850, according to Marzeion et al., 2014. At that time, climate change was a mix between human impact and natural variability of climate. Glacier response times to change in climate are typically decades, which means that a change happening, for instance, today, still has consequences on glaciers tens of years after. Today, the retreat of glaciers is thus a mixed response to natural climate variability and current anthropogenic warming. However, since 1850, the anthropogenic warming contribution to the glacier mass loss has increased from a third to more than two third over the last two decades.
Similarly to the Greenland ice sheet, glaciers are prone to undergo an acceleration of ice mass loss wherever the limit altitude where rainfall occurs more often than snowfall is higher and at the same time the glacier surface lowers. However, as opposed to ice sheets, glaciers can be found all over the world under various latitudes, temperature and snow regimes, which makes it difficult to establish a unique temperature above which all the glaciers in the world will shrink faster in a nonlinear way. There are, however, model-based global estimates of ice mass loss over the next century. The paper from Marzeion et al., 2018, shows that under 1.5-2°C of global warming, the glaciers will lose the two thirds of their current mass, and that for a 1°C warming, our current level of warming since pre-industrial times, the glacier are still committed to lose one third of their current mass. This means the actions that we take now to limit climate change won’t be seen for decades.
You can find complementary informations in SR15, sections 3.3.9, 3.6.3.2 and in FAQ 3.1.
Sea ice
As very prominently covered by media and our blog (see this post and this post), the Arctic sea-ice cover has been melting due to the increase in CO2 emissions in past decades. To understand the future evolution of climate, climate models are forced with the expected CO2 emissions for future scenarios. In summer, the results of these climate model simulations show that keeping the warming at 1.5°C instead of 2°C is essential for the Arctic sea-ice cover. While at 1.5°C warming, the Arctic Ocean will be ice-covered most of the time, at 2°C warming, there are much higher chances of a sea-ice free Arctic. In winter, however, the ice cover remains similar in both cases.
In the Antarctic, the situation is less clear. On average, there has been a slight expansion of the sea-ice cover (see this post). This is, however, not a clear trend, but is composed of different trends over the different Antarctic basins. For example, a strong decrease was observed near the Antarctic peninsula and an increase in the Amundsen Sea. The future remains even more uncertain because most climate models do not represent the Antarctic sea-ice cover well. Therefore, no robust prediction could be made for the future.
You can find all references were these results are from and more details in Section 3.3.8 of the SR15. Also, you can find the impact of sea-ice changes on society in Section 3.4.4.7.
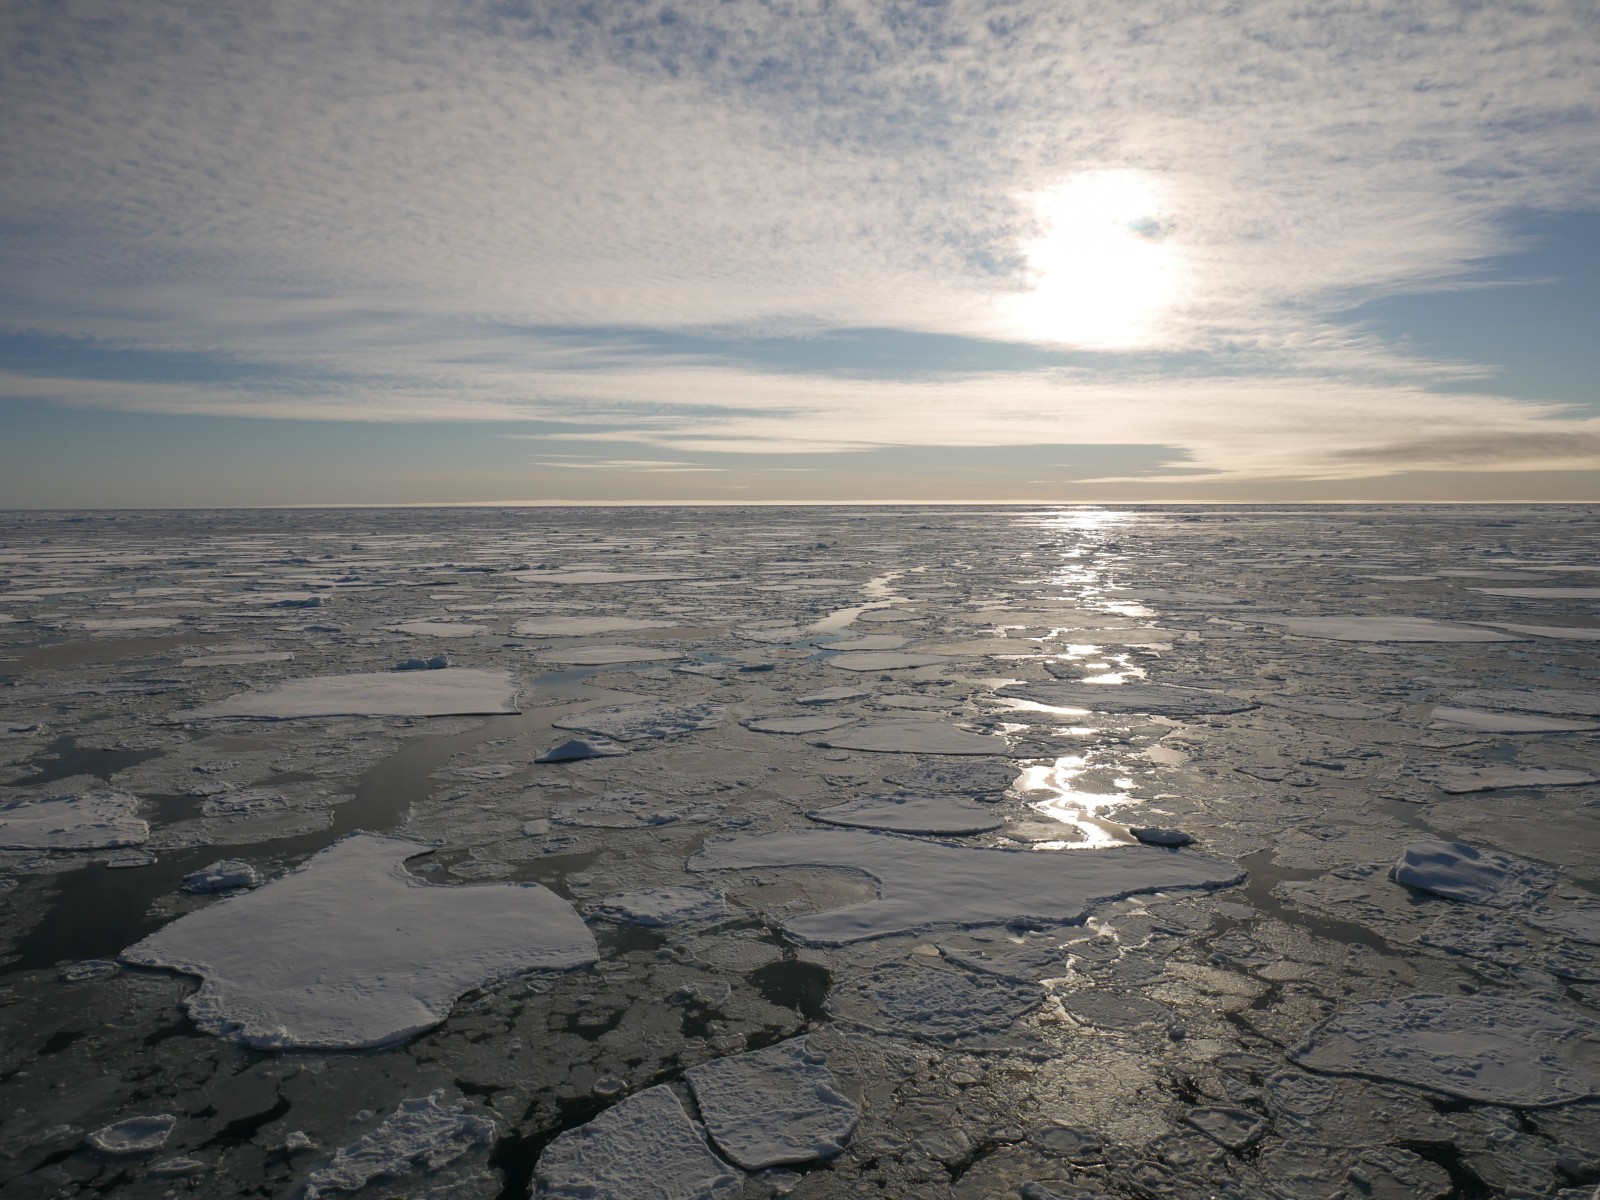
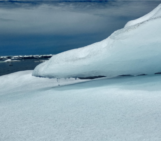
Caption: Sea ice in the Arctic Ocean [D. Olonscheck]
Permafrost
Permafrost is ground that is frozen consecutively for two years or more. It covers large areas of the Arctic and the Antarctic and is formed or degraded in response to surface temperatures. Every summer, above-zero temperatures thaw a thin layer at the surface, and below this, we find the boundary to the permafrost. The depth to the permafrost is in semi-equilibrium with the current climate.
The global area underlain by permafrost globally will decrease with warming, and the depth to the permafrost will increase. In a 1.5°C warmer world, permafrost extent is estimated to decrease by 21-37 % compared to today. This would, however, preserve 2 millions km2 more permafrost than in a 2°C warmer world, where 35-47 % of the current permafrost would be lost.
Permafrost stores twice as much carbon (C) as the atmosphere, and permafrost thaw with subsequent release of CO2 and CH4 thus represents a positive feedback mechanism to warming and a potential tipping point. However, according to estimates cited in the special report, the release at 1.5°C warming (0.08-0.16 Gt C per year) and at 2°C warming (0.12-0.25 Gt C per year) does not bring the system at risk of passing this tipping point before 2100. This is partly due to the energy it takes to thaw large amounts of ice and the soil as a medium for heat exchange, which results in a time lag of carbon release.
The response rates of carbon release is, however, a topic for continuous discussion, and the carbon loss to the atmosphere is irreversible, as permafrost carbon storage is a slow process, which has occurred over millennia.
Changes in albedo from increased tree growth in the tundra, which will affect the energy balance at the surface and thus ground temperature, is estimated to be gradual and not be linked to permafrost collapse as long as global warming is held under 2°C.
The above-mentioned estimates and predictions are from the IPCC special report Section 3.5.5.2, 3.5.5.3 and 3.6.3.3.
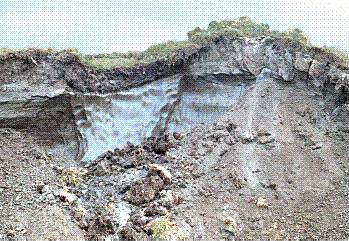
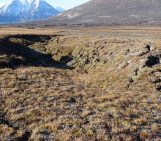
Slope failure of permafrost soil [Credit: NASA, Wikimedia Commons].
So, in summary…
In summary, what can we say? Although the 1.5°C and 2°C limits were chosen as a consensus between historical claims based on physics and a number that is easy to communicate (see this article), it seems that there are some thresholds for parts of the cryosphere exactly between the two limits. This can have consequences on longer term, e.g. sea-level rise or permanent permafrost loss. Additionally, as the cryosphere experts and lovers that we are here in the blog team, we would mourn the loss of these exceptional landscapes. We therefore strongly hope that the COP24 will bring more solution and cooperation for the future against strengthening of climate change!
Further reading
- Marzeion, B., Cogley, J. G., Richter, K., and Parkes, D. (2014). Attribution of global glacier mass loss to anthropogenic and natural causes. Science, 345(6199):919–921. doi:10.1126/science.1254702.
- Marzeion, B., Kaser, G., Maussion, F., and Champollion, N. (2018). Limited influence of climate change mitigation on short-term glacier mass loss. Nat. Clim. Chang., 8:1–4. doi:10.1038/s41558-018-0093-1.
- Pattyn, F., Ritz, C., Hanna, E., Asay-Davis, X., DeConto, R., Durand, G., Favier, L., Fettweis, X., Goelzer, H., Golledge, N. R., Munneke, P. K., Lenaerts, J. T. M., Nowicki, S., Payne, A. J., Robinson, A., Seroussi, H., and Tr, M. (2018). The Greenland and Antarctic ice sheets under 1.5°C global warming. Nat. Clim. Chang., 8:1053–1061. doi:10.1038/s41558-018-0305-8.
- IPCC Special Report Global Warming of 1.5°C
- Image of the Week – Climate change and disappearing ice
- Image of the Week – Climate Change and the Cryosphere
- Image of the Week – Arctic changes in a warming climate
Edited by Clara Burgard and Violaine Coulon
 Lionel Favier is a glaciologist and ice-sheet modeller, currently occupying a post-doctoral position at IGE in Grenoble, France. He’s also on twitter.
Laura Helene Rasmussen is a Danish permafrost scientist working at the Center for Permafrost, University of Copenhagen. She has spent many seasons in Greenland, working with the Greenland Ecosystem Monitoring Programme and is interested in Arctic soils as an ecosystem component, their climate sensitivity, functioning and simply understanding what goes on below.
 Clara Burgard is a PhD student at the Max Planck Institute for Meteorology in Hamburg. She investigates the evolution of sea ice in general circulation models (GCMs). There are still biases in the sea-ice representation in GCMs as they tend to underestimate the observed sea-ice retreat. She tries to understand the reasons for these biases. She tweets as @climate_clara.

