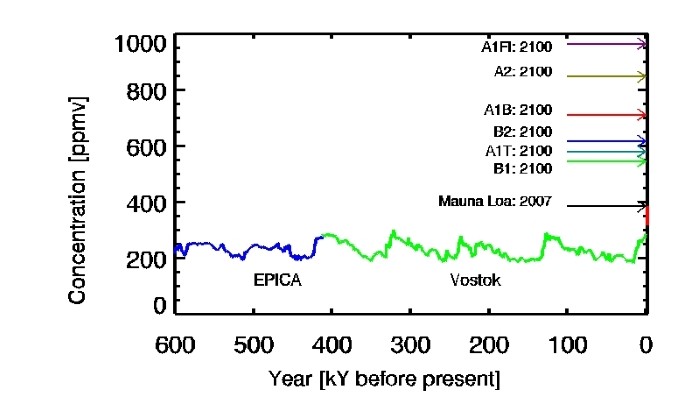
CO2 concentrations from EPICA and Vostok ice cores. The red bar at the side shows the Mauna Loa measurements. Credit: The IPCC AR 4 report Fig. 6.3
The measurements of atmospheric CO2 levels at Manu Loa, Hawaii read 401.01ppm on the 7th of December this year. To understand the significance of this number, you just need to look at the figure above from the 4th IPCC report. It shows the changes in CO2 concentrations during the past 800,000 years based on ice core measurements. Values have fluctuated between 190ppm and 280ppm. In other words, both the level of present-day atmospheric CO2 and the rapidity of the increase is unprecedented.
The figure also shows the projections from the IPCC AR4 report for different emission scenarios. Which scenario will turn out to be the most likely might be determined at COP21 in Paris right now.
Read more: