The reduction in Arctic sea-ice cover has been in the news a lot recently (e.g. here) – as record lows have been observed again and again within the last decade. However, it is also a topic which causes a lot of confusion as so many factors come into play. With this Image of the Week we will give you a brief overview of the ups and downs of sea ice!
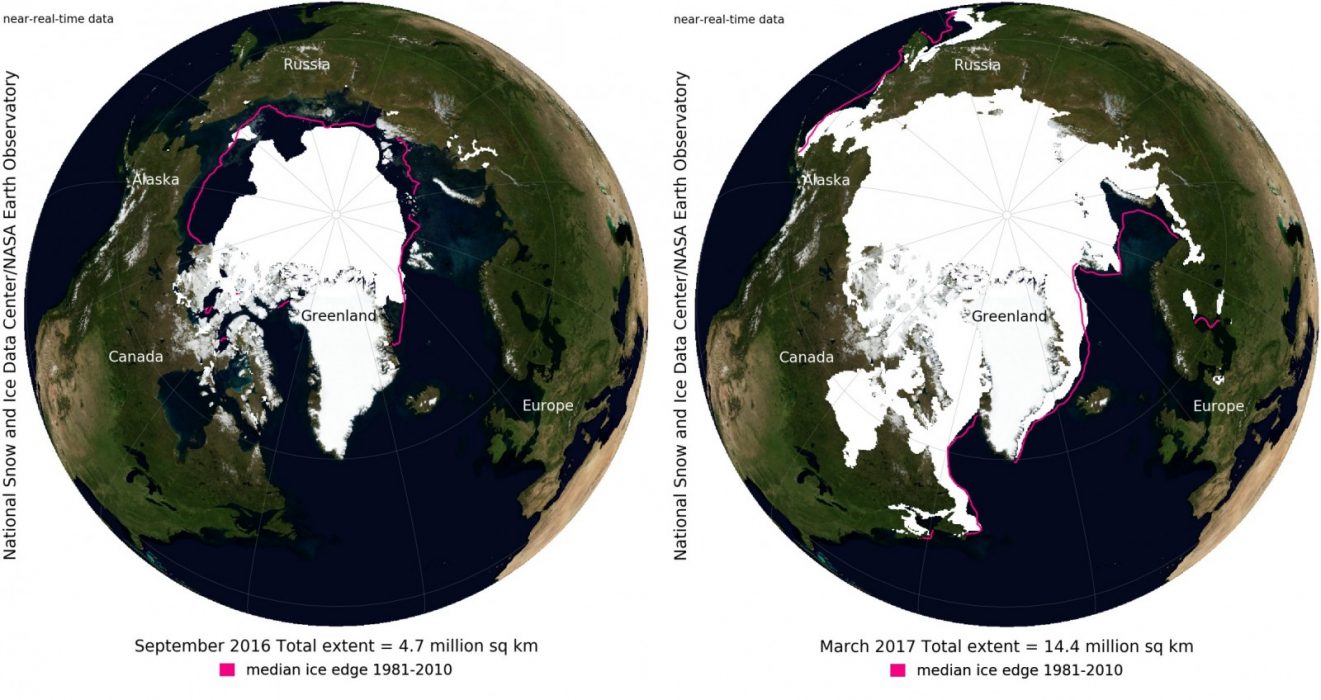
In general, Arctic sea ice is at its minimum extent at the end of the summer (September), and its maximum extent at the end of the winter (March). Our Image of the Week (Fig. 1) shows the summer and winter sea ice cover over the last year. In September 2016, the Arctic sea-ice minimum covered the second smallest extent since the beginning of satellite observations (38 years). Only 4.14 million square kilometres of the Northern Hemisphere were covered by sea ice on the day of minimum extent (September 10th). The maximum sea-ice extent was observed on March 7th 2017, only 14.42 million square kilometres of sea ice were observed: the lowest maximum since the beginning of satellite observations.
How long do we have until Arctic summer sea-ice cover is completely gone?
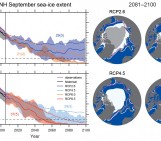
The Arctic Ocean is defined as ice-free, when the sea-ice area does not exceed 1 million km². Due to the close relationship between CO2 emissions and the sea-ice area (see one of our previous posts), it is likely that the summer Arctic sea-ice cover will fall below this threshold during the 21st century. Under the highest emission scenario (RCP 8.5 – IPCC, 2015), an almost ice-free Arctic in September is likely to occur before the middle of the century. It is, however, not easy to predict the exact year of an ice-free Arctic summer as the extent of the ice cover depends on many parameters influencing the freezing and melting of the ice.
On one hand, some parameters and their effect on the sea-ice cover are well understood and their future evolution can be projected quite well through climate models. For example, changes in the sea surface temperature tend to affect the starting date of the freezing period while changes in air temperature tend to affect the starting date of the melting period. As both air temperature and sea surface temperature are projected to increase in the long term, due to climate change, the period where ice can be present will be reduced more and more.
On the other hand, some parameters lead to several concurring effects, which are difficult to separate clearly and not always fully understood. Therefore, their future evolution and influence on sea ice is not totally clear. For example, the sea-ice loss leads to more open ocean areas, which absorb solar radiation, causing warming and therefore leading to faster sea-ice melting – a mechanism called “sea-ice albedo feedback”. At the same time, more open ocean areas also lead to more evaporation and therefore more clouds, which shield the ice from solar radiation and therefore lead to less warming of the ice and ocean surfaces.
Still, even if we knew the effect and long-term evolution of all these parameters, the exact date of ice-free Arctic could not be defined easily in advance. Why? The chaotic nature of the atmosphere leads to very short-term effects that influence the ice cover as well…
Be careful! A record minimum does not always mean a record maximum (and vice versa)!
On shorter time scales, sudden changes in the atmospheric circulation can have a large impact on sea-ice extent. Therefore, it is not guaranteed that a year with a record low maximum will have a record low minimum and vice versa. For example, heat waves and warm air outbreaks or high winds due to the transport of low pressure systems into the Arctic can lead to a more rapid decline of the sea-ice cover. The other way round, if the atmosphere from lower latitudes does not disturb the Arctic region, the sea-ice cover can stabilise again.
What about this year (2016/2017 season)?
Sometimes, it is not clear why sea-ice retreats rapidly. For example, the low 2016 minimum came as a surprise as the cover started with a very low minimum but then did not melt as fast as in previous years, due to average or below average temperatures. Only shortly before the minimum extent, stormy conditions came into play and led to the low extent that was observed (see Fig. 2).
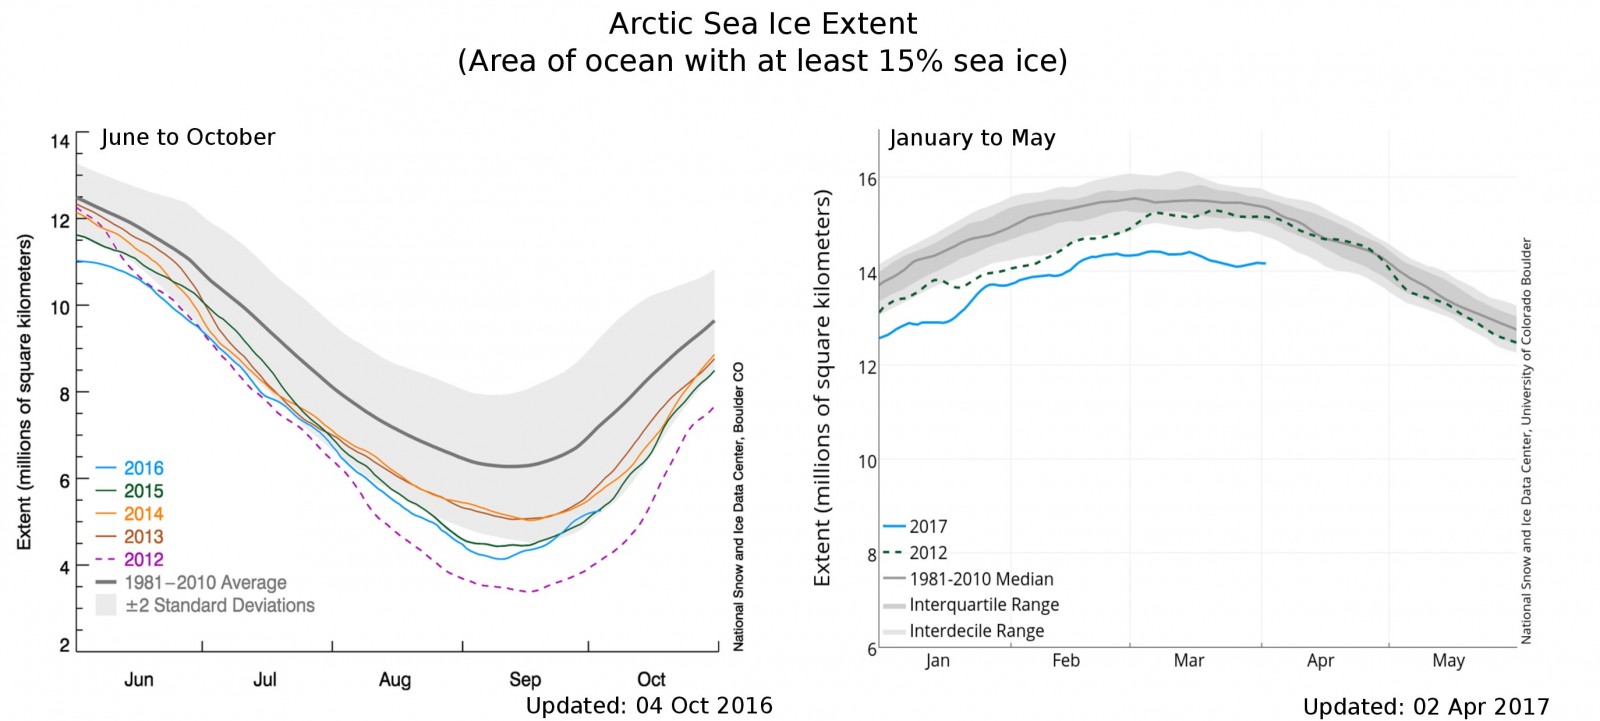
Figure 2: Comparison of Arctic sea-ice extent between different years for summer (left) and winter (right). [Credit: Image courtesy of the National Snow and Ice Data Center]
The reasons for the record low 2017 maximum are better understood. The Arctic Ocean was not covered by much ice to begin. Then, the autumn and winter in the Arctic were very warm with air temperatures from October 2016 to February 2017 being from 2.5 to up to 5 degrees in some regions higher than on average.
From the Arctic to the Antarctic
In the last decades, although it recovered in some years between the record lows, the Arctic sea-ice cover has overall been declining. This is not the case on the other side of the planet, in Antarctica. Note that Antarctica is a complete different setting than the Arctic Ocean. The former being a continent surrounded by ocean and sea ice, the latter being an ocean with sea ice surrounded by continents.
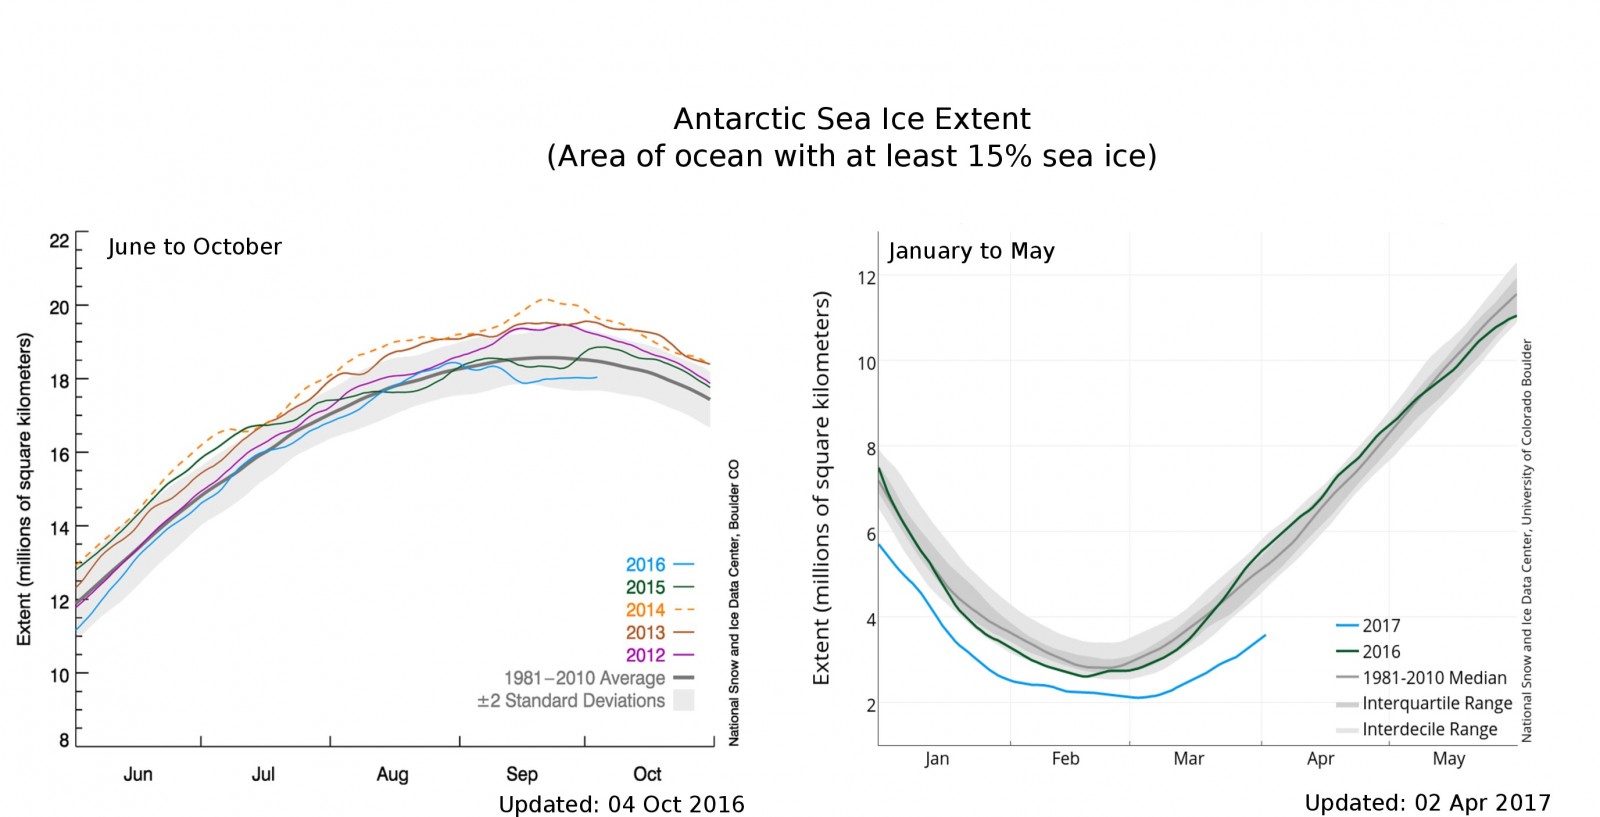
Figure 3: Comparison of Antarctic sea-ice extent between different years for summer (left) and winter (right). [Credit: Image courtesy of the National Snow and Ice Data Center]
In recent decades, Antarctic sea-ice has been increasing very slowly (see Fig.3). Scientists were puzzled as such an evolution was not expected in a global warming framework. Explanations for this behaviour are that this is likely due to changing wind and surface pressure patterns around Antarctica. Contrary to this trend, this year (2016/2017) was a record low maximum and minimum in Antarctic sea-ice cover. This change is puzzling scientists even more. It remains unclear up to now if this is a permanent shift in the tendency of Antarctic sea ice or if this a single event. Be sure that the next months will be full of papers trying to explain this change in behaviour, it is going to be exciting!
Further reading
- National Snow and Ice Data Center, University of Colorado, Boulder, USA.
- Arctic Sea Ice Blog
- Image of the week – Climate Change and the Cryosphere
- Image of the week – The warming effect of the decline of Arctic Sea Ice
- Image of the Week – For each tonne of CO2 emitted, Arctic sea ice shrinks by 3m2 in summer
Edited by Emma Smith
![Image of the Week – On thin [Arctic sea] ice](https://blogs.egu.eu/divisions/cr/files/2018/10/kayak-161x141.jpg)

Pingback: Cryospheric Sciences | Image of the Week – On thin [Arctic sea] ice
Pingback: Cryospheric Sciences | Ice-hot news: The cryosphere and the 1.5°C target
Pingback: Cryospheric Sciences | Climate Change & Cryosphere – Why is the Arctic sea-ice cover retreating?
Pingback: Cryospheric Sciences | Image of the Week – Did you know that Arctic sea ice is melting from the bottom?
Pingback: Cryospheric Sciences | Will the Arctic be ice free earlier than previously thought?
Pingback: Cryospheric Sciences | Did you know the differences between Arctic and Antarctic sea ice?