Last week at the 2016 General Assembly Sara, one of the EGU’s press assistants, had the opportunity to speak to Koen Van Noten about his research into how crowdsourcing can be used to find out more about where earthquakes have the biggest impact at the surface.
Firstly, can you tell me a little about yourself?
I did a PhD in structural geology at KULeuven and, after I finished, I started to work at the Royal Observatory of Belgium. What I do now is try to understand when people feel an earthquake, why they can feel it, how far away from the source they can feel it, if local geology affects the way people feel it and what the dynamics behind it all are.
How do you gather this information?
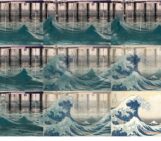
People can go online and fill in a ‘Did You Feel It?’ questionnaire about their experience. In the US it’s well organised because the USGS manages this system in whole of the US. In Europe we have so many institutions, so many countries, so many languages that almost every nation has its own questionnaire and sometimes there are many inquiries in only one country. This is good locally because information about a local earthquake is provided in the language of that country, but if you have a larger one that crosses all the borders of different countries then you have a problem. Earthquakes don’t stop at political borders; you have to somehow merge all the enquiries. That’s what I’m trying to do now.
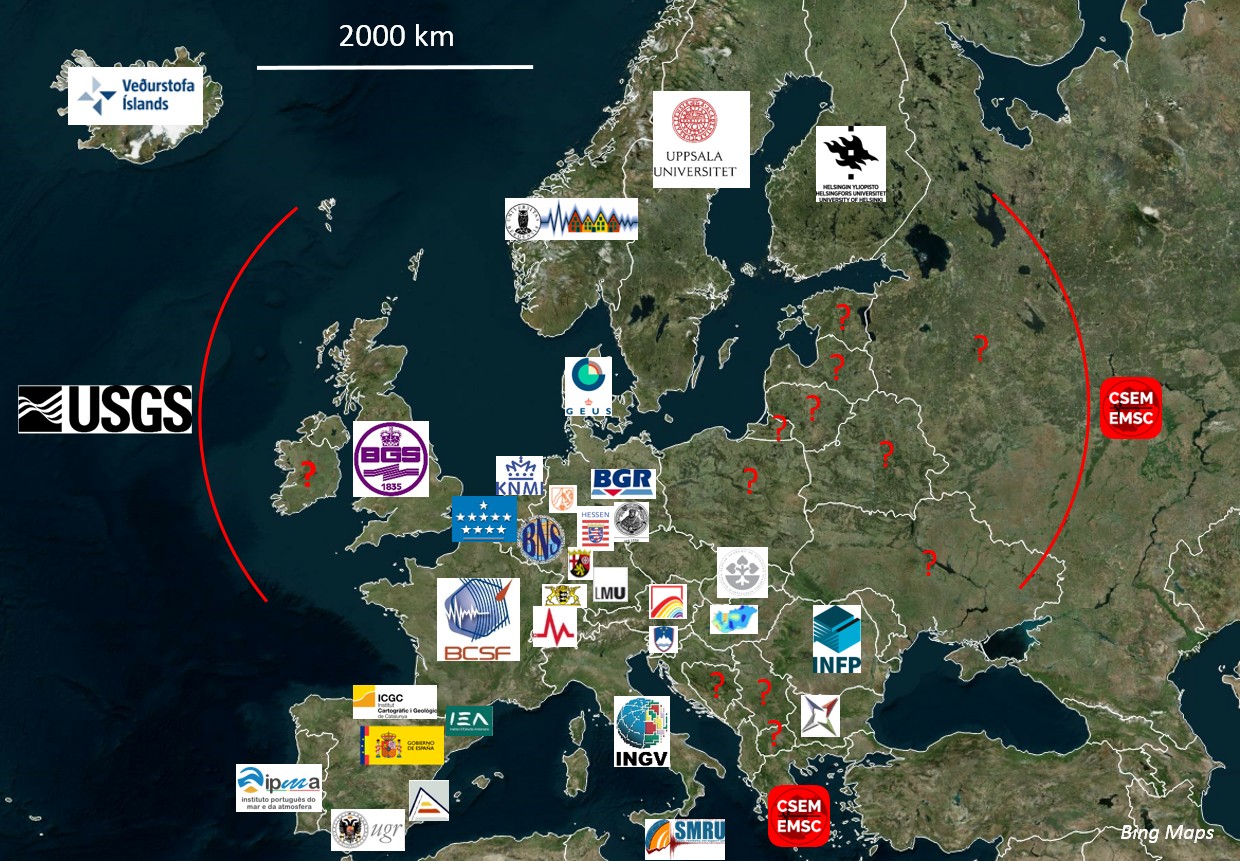
European institutes that provide an online “Did You Feel the Earthquake?” inquiry. (Credit: Koen Van Noten)
There are lots of these databases around the world, how do you combine them to create something meaningful?
You first have to ask the different institutions if you can use their datasets, that’s crucial – am I allowed to work on it? And then find a method to merge all this information so that you can do science with it.
You have institutions that capture global data and also local networks. They have slightly different questions but the science behind them is very similar. The questions are quite specific, for instance “were you in a moving vehicle?” If you answer yes then of course the intensity of the earthquake has to be larger than one felt by somebody who was just standing outside doing nothing and barely felt the earthquake. You can work out that the first guy was really close to the epicentre and the other guy was probably very far, or that the earthquake wasn’t very big.
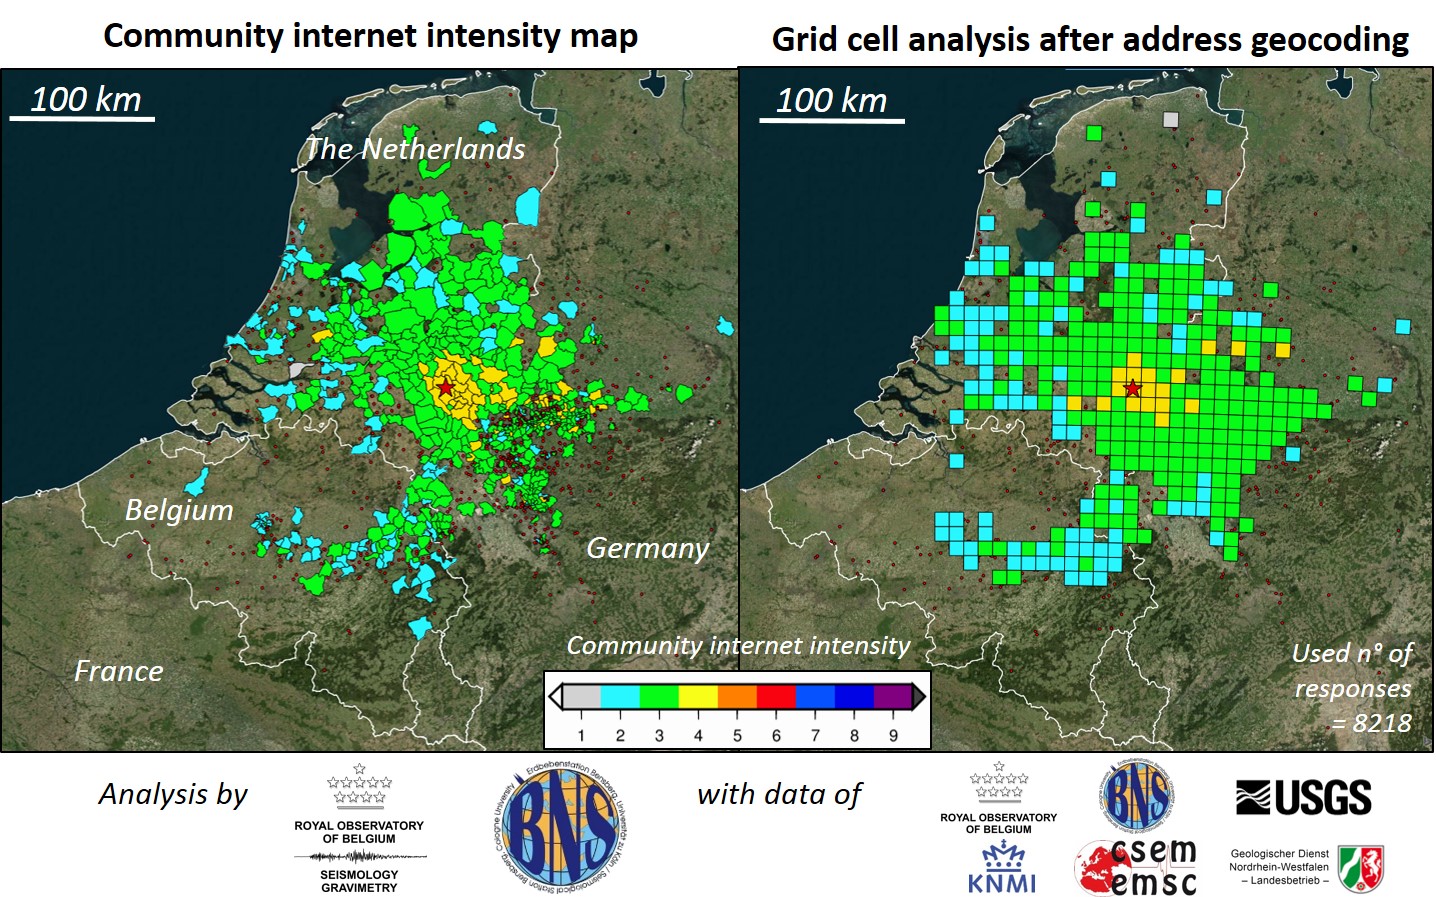
Usually intensities are shown in community maps. To merge all answers of all institutes, I avoid the inhomogeneous community maps. Instead I use 100 km2 grid cell maps and assign an intensity to every grid cell.. This makes the felt effect easy to read and allows you to plot data without giving away personal details of any people that responded. Institutes do not always provide a detailed location, but in a grid cell the precise location doesn’t matter. It’s a solution to the problem of merging databases within Europe and also globally.
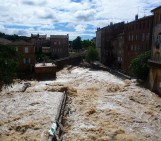
Underlying geology can have a huge impact on how an earthquake is felt. 2011 Goch ML 4.3 earthquake. Credit: Koen Van Noten.
What information can you gain from using these devices?
If you make this graph for a few earthquakes, you can map the decay in shaking intensity in a certain region. I’m trying to understand how the local geology affects these kinds of maps. Somebody living on thick pile of sands, several kilometres above the hypocentre, won’t feel it because the sands will attenuate the earthquake. They are safe from it. However, if they’re directly on the bedrock, but further from the epicentre, they may still feel it because the seismic waves propagate fast through bedrock and aren’t attenuated.
What’s more, you can compare recent earthquakes with ones that happened 200 years ago at the same place. Historical seismologists map earthquake effects that happened years ago from a time when no instrumentation existed, purely based on old personal reports and journal papers. Of course the amount of data points isn’t as dense as now, but even that works.
Can questionnaires be used as a substitute for more advanced methods in areas that are poorly monitored?
Every person is a seismometer. In poorly instrumented regions it’s the perfect way to map an earthquake. The only thing it depends on is population density. For Europe it’s fine, you have a lot of cities, but you can have problems in places that aren’t so densely populated.
Can you use your method to disseminate information as well as gather it, say for education?
The more answers you get, the better the map will be. Intensity maps are easier to understand by communities and the media because they show the distribution of how people felt it, rather than a seismogram, which can be difficult to interpret.
What advice would you give to another researcher wanting to use crowd-sourced information in their research?
First get the word out. Because it’s crowd-sourced, they need to be warned that it does exist. Test your system before you go online, make sure you know what’s out there first and collaborate. Collaborating across borders is the most important thing to do.
Interview by Sara Mynott, EGU Press Assistant and PhD student at Plymouth University.
Koen presented his work at the EGU General Assembly in Vienna. Find out more about it here.