The August 2020 NPG Paper of the Month award goes to Josh Jacobson and colleagues for their paper “Beyond univariate calibration: verifying spatial structure in ensembles of forecast fields” (https://doi.org/10.5194/npg-27-411-2020).
The ability to know the future has long been sought after and coveted. Yet, in contrast to prophecies and crystal balls, modern methods of prediction are subject to scientific evaluation and verification. In ensemble forecasting of physical processes, diagnostic tools and metrics are employed to assess the performance of a forecast as well as establish a common point of comparison with other forecast methodologies. There are many well established verification methods available for ensemble forecasts of univariate quantities, i.e. those which study each location and each forecast lead time separately. For example, the verification rank histogram discussed in Hamill (2001) is used to diagnose errors in an ensemble’s mean and spread. For physical processes like precipitation, however, it is also important that forecasted accumulations over a spatial domain are predicted accurately. This is an added difficulty which requires adequate representation of spatial structure by the ensemble.
In “Beyond univariate calibration: verifying spatial structure in ensembles of forecast fields” (https://doi.org/10.5194/npg-27-411-2020), we study the properties of the fraction of threshold exceedance (FTE) histogram, a new diagnostic tool designed for verification of spatially indexed ensemble forecast fields. The FTE is calculated for each ensemble member and the corresponding verification field separately as the fraction of grid points where a prescribed threshold (e.g. 10 mm) is exceeded. The idea is to establish a mapping from a multivariate quantity (i.e., a spatial field) to a univariate quantity (i.e., the FTE) which can then be studied using familiar tools like the verification rank histogram. Using a threshold approach makes the FTE straightforward to interpret and highly relevant to practitioners who are interested in studying the different levels of a weather element separately. Common examples include occurrence of precipitation, above average temperature, and high wind speeds. However, it is not obvious whether FTE histograms are sufficiently sensitive to misrepresentation of the spatial structure by the ensemble, and the goal here is to investigate this discrimination ability in detail.
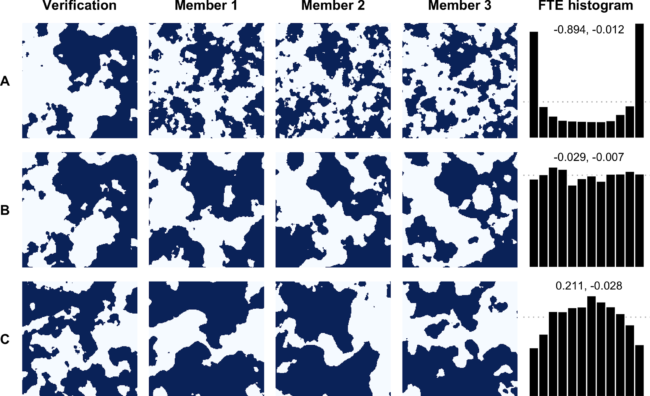
The spatial structure of a field is an abstract quantity that cannot be measured or directly characterized. In simulations, spatial structure is modeled via the correlation length parameter of a covariance function. In order to study the discrimination ability of FTE histograms, we perform a study on simulated fields where we can control the degree to which the spatial structure of the ensemble is miscalibrated through the correlation length parameters of the simulated verification and ensemble mean. When the verification and ensemble fields have the same correlation length, the ensemble is said to be calibrated. This should result in a uniform FTE histogram — of course, such perfect calibration is generally not the case. Possible deviations from a uniform FTE histogram are listed in our Table 1, along with interpretations as to the type of spatial miscalibration in the ensemble. For instance, the top row of the accompanying Figure illustrates how the FTE histogram takes a cup-shape when the correlation length of the ensemble is too small, resulting in excessive spatial variability in the ensemble members. The reverse effect can be observed on the bottom row of the same Figure.
Looking at the ensemble members in the Figure, it’s likely that a practitioner would not need an FTE histogram to determine the type of spatial miscalibration in this case. The true utility of the FTE histogram is realized when the miscalibration is not visually obvious. Critically, we find that FTE histograms accurately identify even minor disagreements with the true correlation length (e.g., 10% miscalibration) in ensemble forecasts, and this conclusion was consistent across a range of thresholds and domain sizes. Having established the discriminative ability of the FTE histogram in our simulation study, we applied the method in a data example with downscaled precipitation forecast fields. There we found that the FTE metric pointed to some shortcomings of the underlying spatial disaggregation algorithm during the seasons where precipitation is driven by local convection, a result that was not apparent from univariate verification metrics alone.