The May 2021 NPG Paper of the Month award goes Abhirup Banerjee and his co-authors for their paper “Recurrence analysis of extreme event-like data“.
Abhirup is pursuing a doctoral degree in Theoretical Physics at University of Potsdam. He is working at Potsdam Institute of Climate Impact Research as a guest researcher as part of the DFG funded NatRiskChange project. In this project, he uses recurrence analysis to compare the recurrence properties of different potential drivers underlying the temporal changes of flood hazards. He is working on further methodological developments of this technique to extend its capabilities to study event-like data (extreme events), data with uncertainties, and spatio-temporal recurrences. Abhirup has a Master’s degree in Physics from Bharathidasan University, Trichy, India.
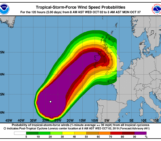
Extreme events attract considerable attention in the scientific community across different disciplines due to their significant impact on economy and human lives. Floods are examples of natural extreme events that cause substantial loss of economic assets and lives. Although extreme events seem stochastic, they manifest a complex dynamical system and often have an inherent recurring behavior.
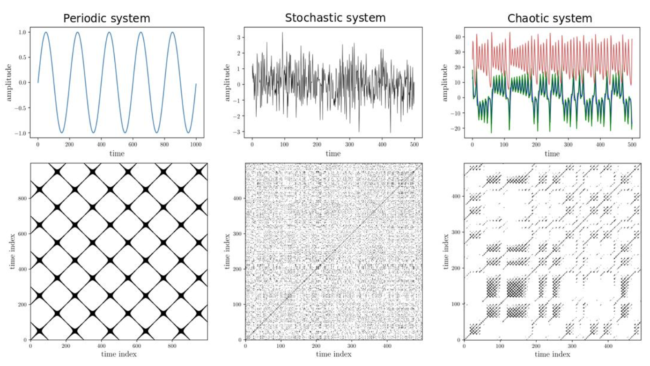
When studying such complex systems, linear methods seldom capture the whole picture as the system itself is nonlinear. Recurrence plot analysis is a robust nonlinear framework that helps us to visualize and quantify a system’s underlying dynamics.
The underlying dynamics of a system can be qualitatively evaluated by looking at the pattern of a recurrence plot. For a quantitative understanding, the line structure of a recurrence plot is used.
The conventional recurrence plot analysis is applying Euclidean or any other norm in the system’s phase space to identify recurrences. However, the standard recurrence plot analysis is not suitable for analyzing extreme event-like data because the rarity of such events leads to significant gaps in the data. For such data, the edit distance method is suitable to identify the recurrences in extreme event-like data. The edit distance method was originally proposed as a metric to study the similar patterns between spike events, in the context of neuroscience. In this method, the time series, or the series of events, is divided into small time segments. Then, the similarity between a pair of time segments is calculated using three elementary operations – shifting in time, deletion, and insertion of events.
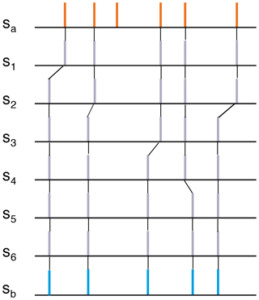
Edit distance transforms segment Sa to Sb by using elementary operations. License: “Recurrence analysis of extreme event-like data“.
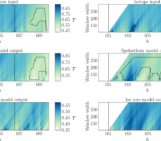
In this new study, the existing edit distance method is improved for extreme event-like data by introducing a nonlinear function that incorporates a temporal tolerance to deal with the quasi-periodic nature of real-world extreme events.
The proposed modified measure is demonstrated on prototypical examples that mimic certain behaviors of extreme natural events. Finally, it is applied to study flood events of the the Mississippi river and revealed a significant serial dependency of flood events. Such a finding suggests some critical implications, like the quasi-periodic occurrence of flood events due to the nonlinear interplay between its drivers.