The original goal of this study was to understand how the local dimension of the attractor of a dynamical system could be used to estimate the predictability of the future state of the system, and apply this in the case of radar images of rain.
The local dimension using Extreme Value Theory (EVT) has been introduced and used in Faranda et al. (2017) to infer the current predictability of different dynamical systems from data. As other definitions of the dimension (such as the dimension of Grassberger and Procaccia (1983)), the EVT dimension δ of a point ζ is based on the fact that the number N of points whose distance to ζ is smaller than R, grows as N ~ Rδ when R is small enough.
The main intuition behind the link between dimension and predictability is the following: if ζ has a high dimension (i.e., if the attractor locally around ζ is high-dimensional), there are many potential directions of evolution for ζ; on the other hand, if the dimension of ζ is low, there are fewer possibilities. This can also be understood in terms of independent degrees of freedom (DOFs): a higher dimension points to a greater number of active DOFs and a more complex dynamics.
Of course, finite values of R have to be chosen for the estimation of the dimension. As pointed out by Datseris et al. (2023), one also needs a way to evaluate the confidence about the computed value of the dimension, and the authors of the latter study proposed to use the NRMSE score. On the other hand, a theoretical result of dynamical systems theory states that the local dimension (computed in the limit of R going to 0) is the same everywhere on the attractor, except on a zero-measure set (Ott, 2002).
Because of these considerations, we studied the dependence of the local dimension with the radius R, and understood that this dependence can be strong. We also pointed out other situations in which the computed value of the dimension is affected. We systematically used the NRMSE score proposed by Datseris et al. (2023), as well as another metric we introduced, in order to detect situations biasing the dimension.
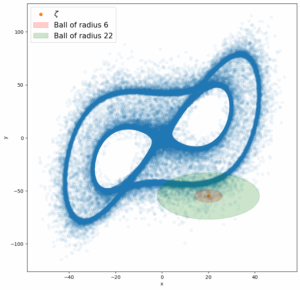
In particular, we found that the local dimension can be used to detect geometrical structures in state space, using the R-dependence of the estimation. Taking for example the Lorenz 63 system in the intermittent regime (ρ = 166.5, see picture), we showed that the estimated dimension strongly depends on whether the main closed loop (the so-called laminar regime) is at a distance smaller than R or not. By inspecting the estimation of the dimension for a given point ζ as a function of R, one can infer the distance between ζ and the laminar regime.
Obviously, for a system whose state space has 3 dimensions, this is not very useful because the attractor can be visualized. However, for higher-dimensional systems, the identification of a geometrical structure (such as a closed loop) is not straightforward, and this technique can help in that task. We tested it on the Lorenz 96 systems with 4, 12 and 50 dimensions.
Another conclusion following from this R-dependence of the dimension, is that we need to compute the dimension over some range of values of R in order to properly interpret the estimated dimension.
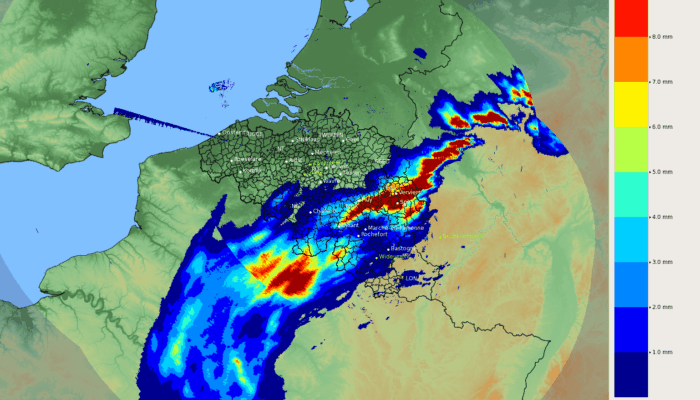
We then computed the local dimension for radar images of rain over Belgium. The difficulty in such real systems is that the number of data points in phase space is limited. For radar datasets in particular, the states for which it would be interesting to be able to compute the dimension are particularly alone in state space. Therefore, the values of R for which the number N of points is large enough to estimate reliably the dimension are large. The estimated dimensions are because of this less local in state space, but it is also more difficult to get a broad enough range of values of R to interpret the values of the dimension. Nevertheless, the values of the dimension we estimated for the radar dataset are mostly around 15-20, possibly indicating that the system has an underlying dimension of that order.

Attractor of the intermittent Lorenz 63 system (rho = 166.5) projected onto the x-y plane. Two different balls used to compute the dimension are displayed around ζ (looking as ellipses because of the different scales for x and y). In the green ball, N ~ R1 because of the presence of the closed loop (laminar regime), so the estimated dimension is around 1; in the red ball, N ~ R2 so that the estimated dimension is around 2. The value of R for which the transition happens is the distance between ζ and the closed loop.
References:
Datseris, G., Kottlarz, I., Braun, A. P., and Parlitz, U.: Estimating fractal dimensions: A comparative review and open source implementations, Chaos, 33, 102101, https://doi.org/10.1063/5.0160394, 2023.
Faranda, D., Messori, G., and Yiou, P.: Dynamical proxies of North Atlantic predictability and extremes, Scientific Reports, https://doi.org/10.1038/srep41278, 2017.
Grassberger, P. and Procaccia, I.: Measuring the strangeness of strange attractors, Physica D: Nonlinear Phenomena, 9, 189–208, https://doi.org/https://doi.org/10.1016/0167-2789(83)90298-1, 1983.
Ott, E.: Chaos in Dynamical Systems, Cambridge University Press, 2 edn., 2002.


