The September 2020 NPG Paper of the Month award goes to Dylan Harries and Terence J. O’Kane for their paper “Applications of matrix factorization methods to climate data” (https://doi.org/10.5194/npg-27-453-2020).
Dylan is a postdoctoral fellow within the Oceans and Atmosphere business unit of CSIRO (Australia). His current research focuses on methods for learning reduced-order models from data, and their applications in studying causal relationships in the climate system.
Terry is leader of the climate forecasting team at CSIRO. Along with Adam Scaife (UK Met Office), he is a current co-chair of the WCRP Grand Challenge in Near Term Climate Prediction. His current interests and research are in coupled data assimilation and ensemble prediction, climate dynamics and causality, and application of statistical dynamics to geophysical fluids.
A familiar challenge in climate science is the need to extract information from very high-dimensional datasets. To do so, the first step is usually the application of a method to reduce the dimension of the data down to a much smaller number of features – that is, combinations of the original variables – that are more amenable to study. The importance of identifying a small set of features that best capture the salient information in the data was recognized early on by Lorenz, among others, whose work on the use of so-called empirical orthogonal functions (EOFs) in statistical weather prediction provided the impetus for widespread adoption of the technique among meteorologists and climate scientists. Nowadays, EOF analysis is one of the most frequently used exploratory tools in the climate scientist’s toolbox.
In the intervening years since Lorenz considered the problem, an extensive literature has developed on a wide range of dimension reduction methods where typically some additional pre-filtering of the data is applied before targeting features relevant to the chosen spatio-temporal scales. Examples from this diverse set of methods include vector quantization, based on clustering methods such as k-means, which encodes a given datapoint by assigning it the label of the closest member in a set of a small number of prototypical observations. EOFs represent the data in terms of linear combinations of orthogonal basis vectors, while archetypal analysis (AA) uses basis vectors chosen to lie on the convex hull – the observed “extremes” – of the data. Although conceptually all of these methods are quite different, they may all be formulated in terms of finding a factorization of the observed design matrix into lower rank factors that optimizes a particular objective function, subject to different constraints on the optimal factors.
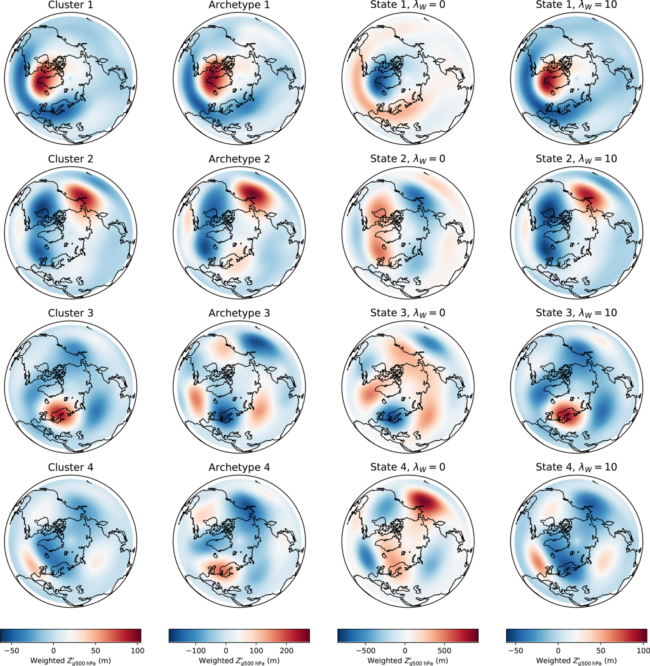
An important consideration in choosing among different such matrix factorizations is how meaningful the resulting representation will be in context; for instance, can the results be directly mapped to distinct physical modes of variability? In “Applications of matrix factorization methods to climate data”, we highlight this through a set of case studies in which the relevant features manifest in dramatically different ways, meaning that certain methods tend to be more useful than others. In sea surface temperature (SST) data, key modes such as El Nino correspond to large temperature anomalies. As a result, describing an SST map in terms of a basis of extreme points, as provided by AA or by related convex codings, is effective in extracting recognizable physical modes. This is not the case when the features of interest do not lie on the boundaries of the observed data, as in the example of quasi-stationary weather patterns. Since these structures are characterized by their recurrent and persistent dynamics, vector quantization methods are more easily interpreted. The accompanying figure shows a four-dimensional basis that results from using k-means, AA (second column), and two different convex codings (third and fourth columns) on Northern Hemisphere geopotential height anomalies. Where a prototypical blocking pattern is clearly evident (cluster 3) in the k-means basis, only by imposing some level of regularization (as in the fourth column) do the methods based on convex encodings yield a similarly direct identification of blocking events.
With the development of many alternative dimension reduction techniques, the climate scientist’s toolbox is increasingly well equipped for extracting and summarizing complex structural information from large, high-dimensional datasets. We emphasize that it is essential when selecting a method to take into account the nature of the representation that results, and how well this aligns with the features of interest. Or, in other words, to choose the right tool for the job.


