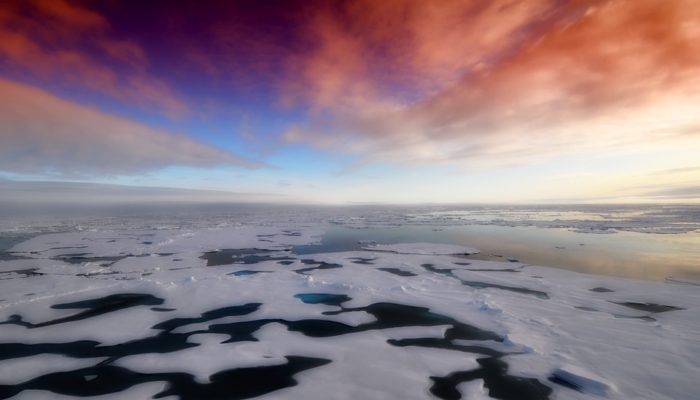
The Arctic Ocean surface is darkening as its sea-ice cover is shrinking. The exact processes driving the ongoing sea-ice loss are far from being totally understood. In this post, we will investigate the different causes of the recent retreat of the Arctic sea-ice cover, using the most updated literature…
Arctic sea ice is disappearing
Due to its geographical position centered around the North Pole, the Arctic Ocean is relatively cold compared to other world oceans. This means that, each winter, ocean temperatures fall below the freezing point, and sea ice forms on top of the ocean surface.
The Arctic sea-ice extent reaches about 15 million km2 in March, at its maximum (see left panel in Fig. 1 and Fig. 2). In spring, the ice starts to melt and reaches its minimum extent in September, which is about three times smaller than its maximum extent (see right panel in Fig. 1 and Fig. 2).
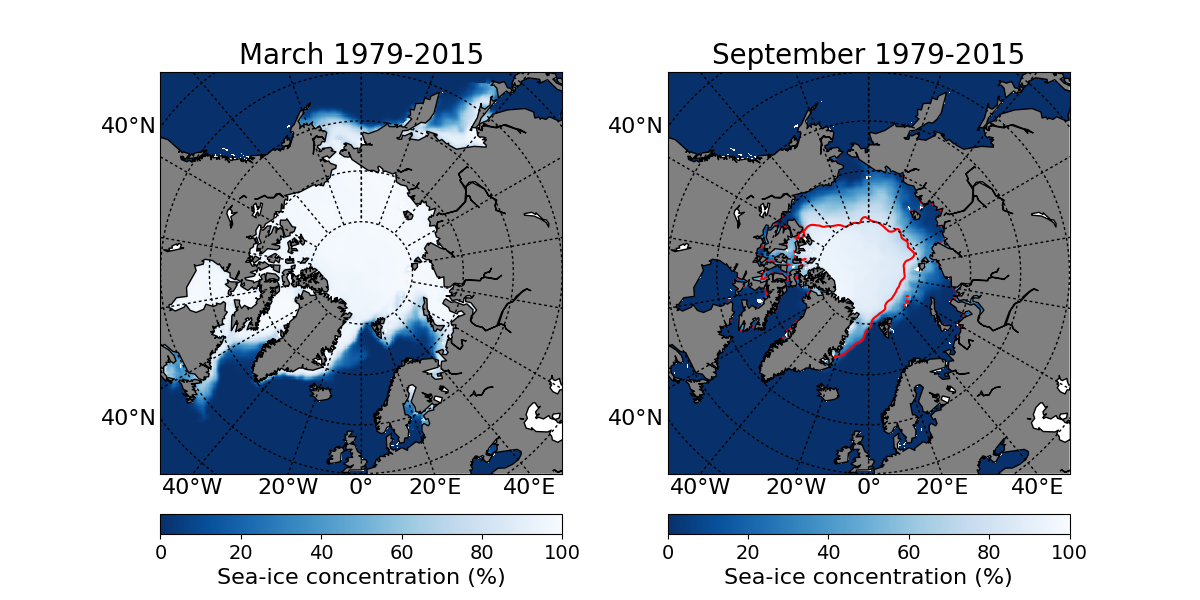
Figure 1: Maps of mean Arctic sea-ice concentration (percentage of sea ice in a given grid cell) in March (left) and September (right), averaged over 1979-2015, from satellite observations. The red line (right panel) shows the sea-ice edge in September 2012 (record minimum) [Credit: Ocean and Sea Ice Satellite Application Facility (OSI SAF)].
Satellite observations clearly show that the Arctic sea-ice cover has been shrinking since the beginning of the satellite record in 1979 (see this post and this post for more information about sea-ice satellite observations). The sea-ice loss is about 13% per decade in September and 3% per decade in March (see this post, this post and this post for further information on recent Arctic sea-ice changes). A recent study using data from a series of different observations (ship reports, airplane surveys, analyses by national services, etc.) shows that the recent Arctic sea-ice loss, as measured by satellites, is unprecedented as far back as 1850.
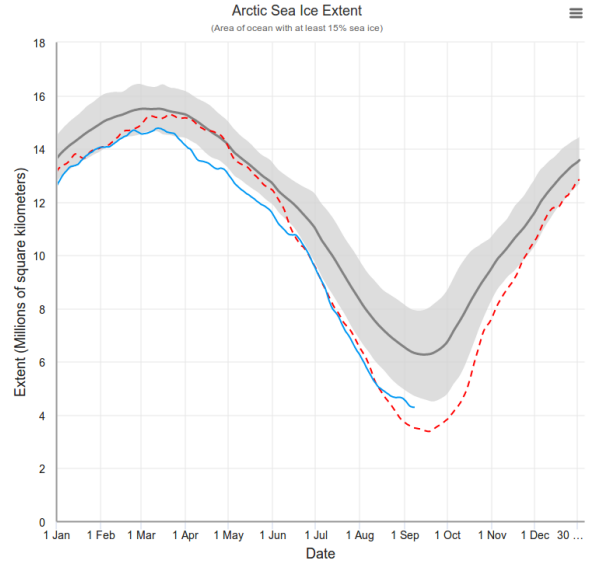
Figure 2: Seasonal cycle of Arctic sea-ice extent from satellite observations. The solid blue and dashed red lines show the 2019 (ongoing) and 2012 (record minimum) values. The dark gray curve shows the average over the period 1981-2010 with the corresponding uncertainty range in light gray (+/- 2 standard deviations) [Credit: National Snow and Ice Data Center].
The year 2012 was particularly exceptional in the sense that it featured the record minimum in September since the beginning of satellite measurements (dashed red curve in Fig. 2). 2019 was on a ‘good path’ to break this record, but the sea-ice loss rate started to lower from mid-August (blue curve in Fig. 2, see also here).
What are the drivers of the Arctic sea-ice loss?
The recent changes in Arctic sea ice have been caused by three main factors:
- External forcing: the variability caused by external factors, which can either be human (e.g. anthropogenic greenhouse gas emissions) or natural (e.g. changes in solar activity, volcanic eruptions).
- Internal variability: the variability caused by the chaotic nature of processes at work in the climate system. It is internal variability that prevents us to make accurate weather forecasts beyond a few days.
- Positive feedbacks: the processes by which a change in the climate can amplify, e.g. the ice-albedo feedback. These feedbacks are described in more detail in this post.
External forcing
Several studies have analyzed the links between the changes in external forcing and the recent changes in Arctic sea ice in both observations and models. It has been found that the anthropogenic global warming, caused by increased greenhouse gas concentration in the atmosphere, is the main driver of the long-term sea-ice loss in the Arctic. In particular, Notz and Stroeve (2016) found that for each ton of CO2 released into the atmosphere, the Arctic loses about 3 m2 of sea ice in September, as shown in Fig. 3 below (see this post).
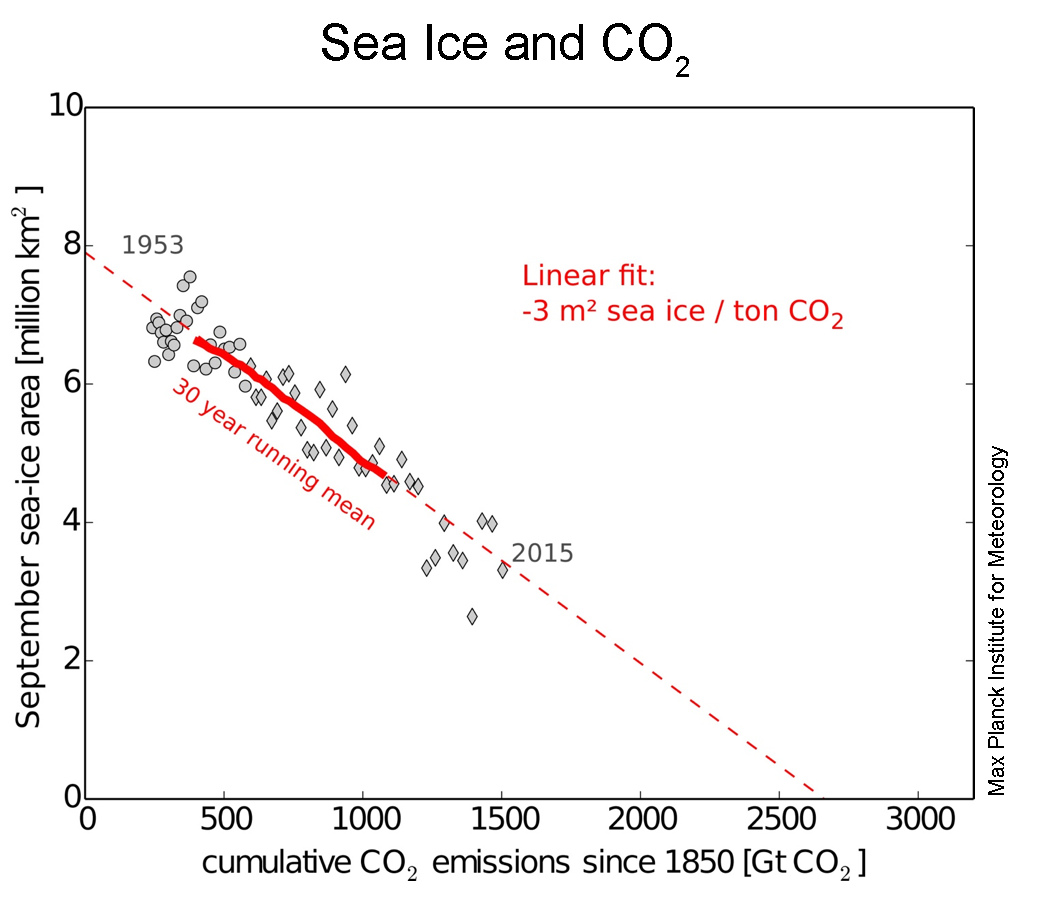
Figure 3: September Arctic sea-ice area against cumulative CO2 emissions since 1850 for the period 1953-2015. Grey circles and diamonds show the results from in-situ (1953-1978) and satellite (1979-2015) observations, respectively. The thick red line shows the 30-year running mean and the dotted red line represents the trend of 3 m2 in sea-ice area loss per ton of CO2 emitted [Credit: D. Notz, based on Notz & Stroeve (2016)].
Other changes in external forcing have had a more limited impact on the recent changes in Arctic sea ice. For example, the volcanic eruptions of El Chichón in 1982 and Mount Pinatubo in 1991 caused a small increase in Arctic sea-ice extent (see this study), but their impact cannot be clearly identified in individual climate models (see here). Similarly, the impact of the solar activity on the recent Arctic sea-ice changes is very small.
Internal variability
The sea-ice evolution is also strongly subject to internal variability. A good explanation of the concept of internal variability can be found here and in this study.
Internal variability is often estimated using climate models. Running the same model with exactly the same parameters and external forcing, but with slightly different initial conditions (for example a different sea surface temperature), is a common method to get an idea of the internal variability of the climate system. Figure 4 below shows the evolution of the Arctic sea-ice extent using the Community Earth System Model (CESM) run 40 times with different initial conditions. The spread of the ensemble represents the range of the effect of internal variability.
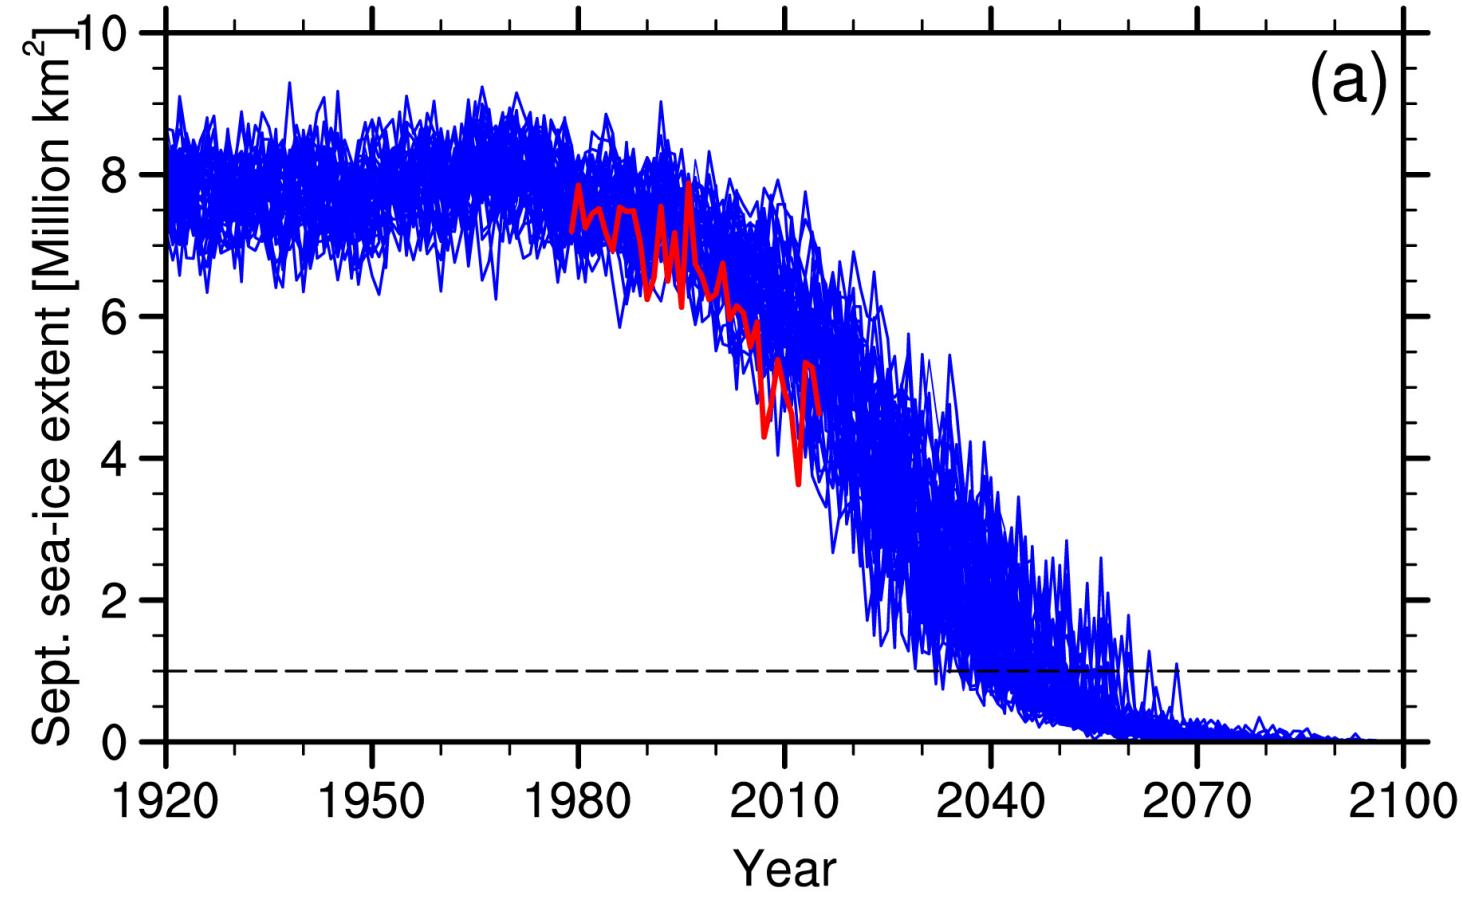
Figure 4: Evolution of Arctic September sea-ice extent using the Community Earth System Model Large Ensemble (CESM-LE) in the less optimistic scenario (RCP8.5). The blue curves show all the 40 model members. The red curve shows the NSIDC satellite observations [Credit: Fig. 1a of Jahn et al. (2016)].
Variations in heat transport from the Atlantic Ocean due to internal variability have caused strong reductions in sea-ice area in the Barents Sea (see this study and this study), and probably other seas located in the Atlantic sector of the Arctic Ocean (as shown here). Changes in large-scale atmosphere circulation, also associated with internal variability, have contributed to sea-ice reductions as well (see this study).
However, several studies found that internal variability was not the key cause of the recent Arctic sea-ice loss over the past 40 years (e.g. this study). Instead, internal variability acts as an amplifier of the external forcing (see this study), so it only explains a small part of the recent Arctic changes. In the climate models used in the IPCC AR5 report, the impact of internal variability is of maximum 1 million km2 (see this study).
Feedbacks
A last cause for the recent changes in Arctic sea ice is the presence of positive feedbacks, which can amplify ongoing changes. One of the main feedbacks acting in the Arctic is the ice-albedo feedback (see this post and this study). Since ice reflects more sunlight than water, if the sea-ice cover decreases, more heat is trapped by the surface of the Arctic Ocean, leading to more ice melting.
However, as we have seen above, there is a clear linear relationship between Arctic sea-ice extent and cumulative CO2 emissions (Fig. 3). If the ice-albedo feedback was important in explaining the recent loss of Arctic sea ice, this linear relationship would break after years of strong or weak ice loss, which is not the case.
In fact, the positive feedbacks (like the ice-albedo feedback) are partly compensated by negative feedbacks that stabilize the climate system (see this previous post for a description of feedbacks in polar regions). Thus, while these feedbacks play a key role in the short term, they cannot explain the bulk part of the sea-ice loss since 1979.
The future
In conclusion, the recent loss of Arctic sea ice is strongly linked to anthropogenic global warming, although the changes in atmosphere circulation and ocean heat transport, associated with internal variability, also influence the sea-ice evolution. Research continues on the topic in order to capture the exact contribution of the different causes to the Arctic sea-ice loss.
On the long term, Arctic sea ice will continue disappearing. Based on the current emission rates of greenhouse gas emissions into the atmosphere, it is probable that the Arctic Ocean will be ice free during summer before 2050 (see this post, this study and this study).
Due to its linear relationship with CO2 emissions, the Arctic sea-ice cover is a strong indicator for the pace of current climate change. Its rapid disappearance should be seen as a warning light for other impacts to come…
Further reading
- Image of the Week – The ups and downs of sea ice.
- Image of the Week – Climate feedbacks demystified in polar regions.
- Image of the Week – For each tonne of CO2 emitted, Arctic sea ice shrinks by 3m2 in summer.
- Notz, D. (2015). How well must climate models agree with observations? Philosophical Transactions of the Royal Society A, 373: 20140164. doi: 10.1098/rsta.2014.0164.
- Notz, D. and J. Stroeve (2018). The trajectory towards a seasonally ice-free Arctic Ocean, Current Climate Change Reports, 4:407–416. doi: 10.1007/s40641-018-0113-2.
Edited by Clara Burgard
 David Docquier is a post-doctoral researcher at the Earth and Life Institute of Université catholique de Louvain (UCL) in Belgium. He works on the development of processed-based sea-ice metrics in order to improve the evaluation of global climate models (GCMs). His study is embedded within the EU Horizon 2020 PRIMAVERA project, which aims at developing a new generation of high-resolution GCMs to better represent the climate.
Thomas Lavergne
I truly appreciated this post, thank you.
A question: Since summer sea-ice decline follows cumulative CO₂ (your Fig 3): IF we would manage to drastically cut global CO₂ emissions in a short period of time, then would it stabilize the ice cover as well? Or is there an inertia in the system and it will still decline?
T.
David Docquier
Hi Thomas,
Thanks for your interesting and important question.
The short answer is yes (good news ;): if CO2 emissions are lowered, then the rate of sea-ice loss will decrease according to the linear relationship between summer sea-ice extent and cumulative CO2 emissions (shown by Notz and Stroeve, 2016), meaning that a stabilization is possible.
Several modeling studies have found that there is no Arctic sea-ice tipping point, i.e. sea-ice recovers if the forcing decreases (e.g. Tietsche et al., 2011 [https://agupubs.onlinelibrary.wiley.com/doi/epdf/10.1029/2010GL045698]; Stranne and Björk, 2012 [https://link.springer.com/article/10.1007%2Fs00382-011-1275-y]). This is partly due to the fact that the positive ice-albedo feedback is compensated by several negative feedbacks acting in winter, e.g. the ice-free areas more effectively lose their heat to the atmosphere than the ice-covered regions.
I suggest that you have a look at these review papers: Section 2.7 of Meier et al. (2014) [https://agupubs.onlinelibrary.wiley.com/doi/10.1002/2013RG000431] and Section 4.2 of Stroeve et al. (2018) [https://iopscience.iop.org/article/10.1088/1748-9326/aade56/meta].
I hope this helps.
David