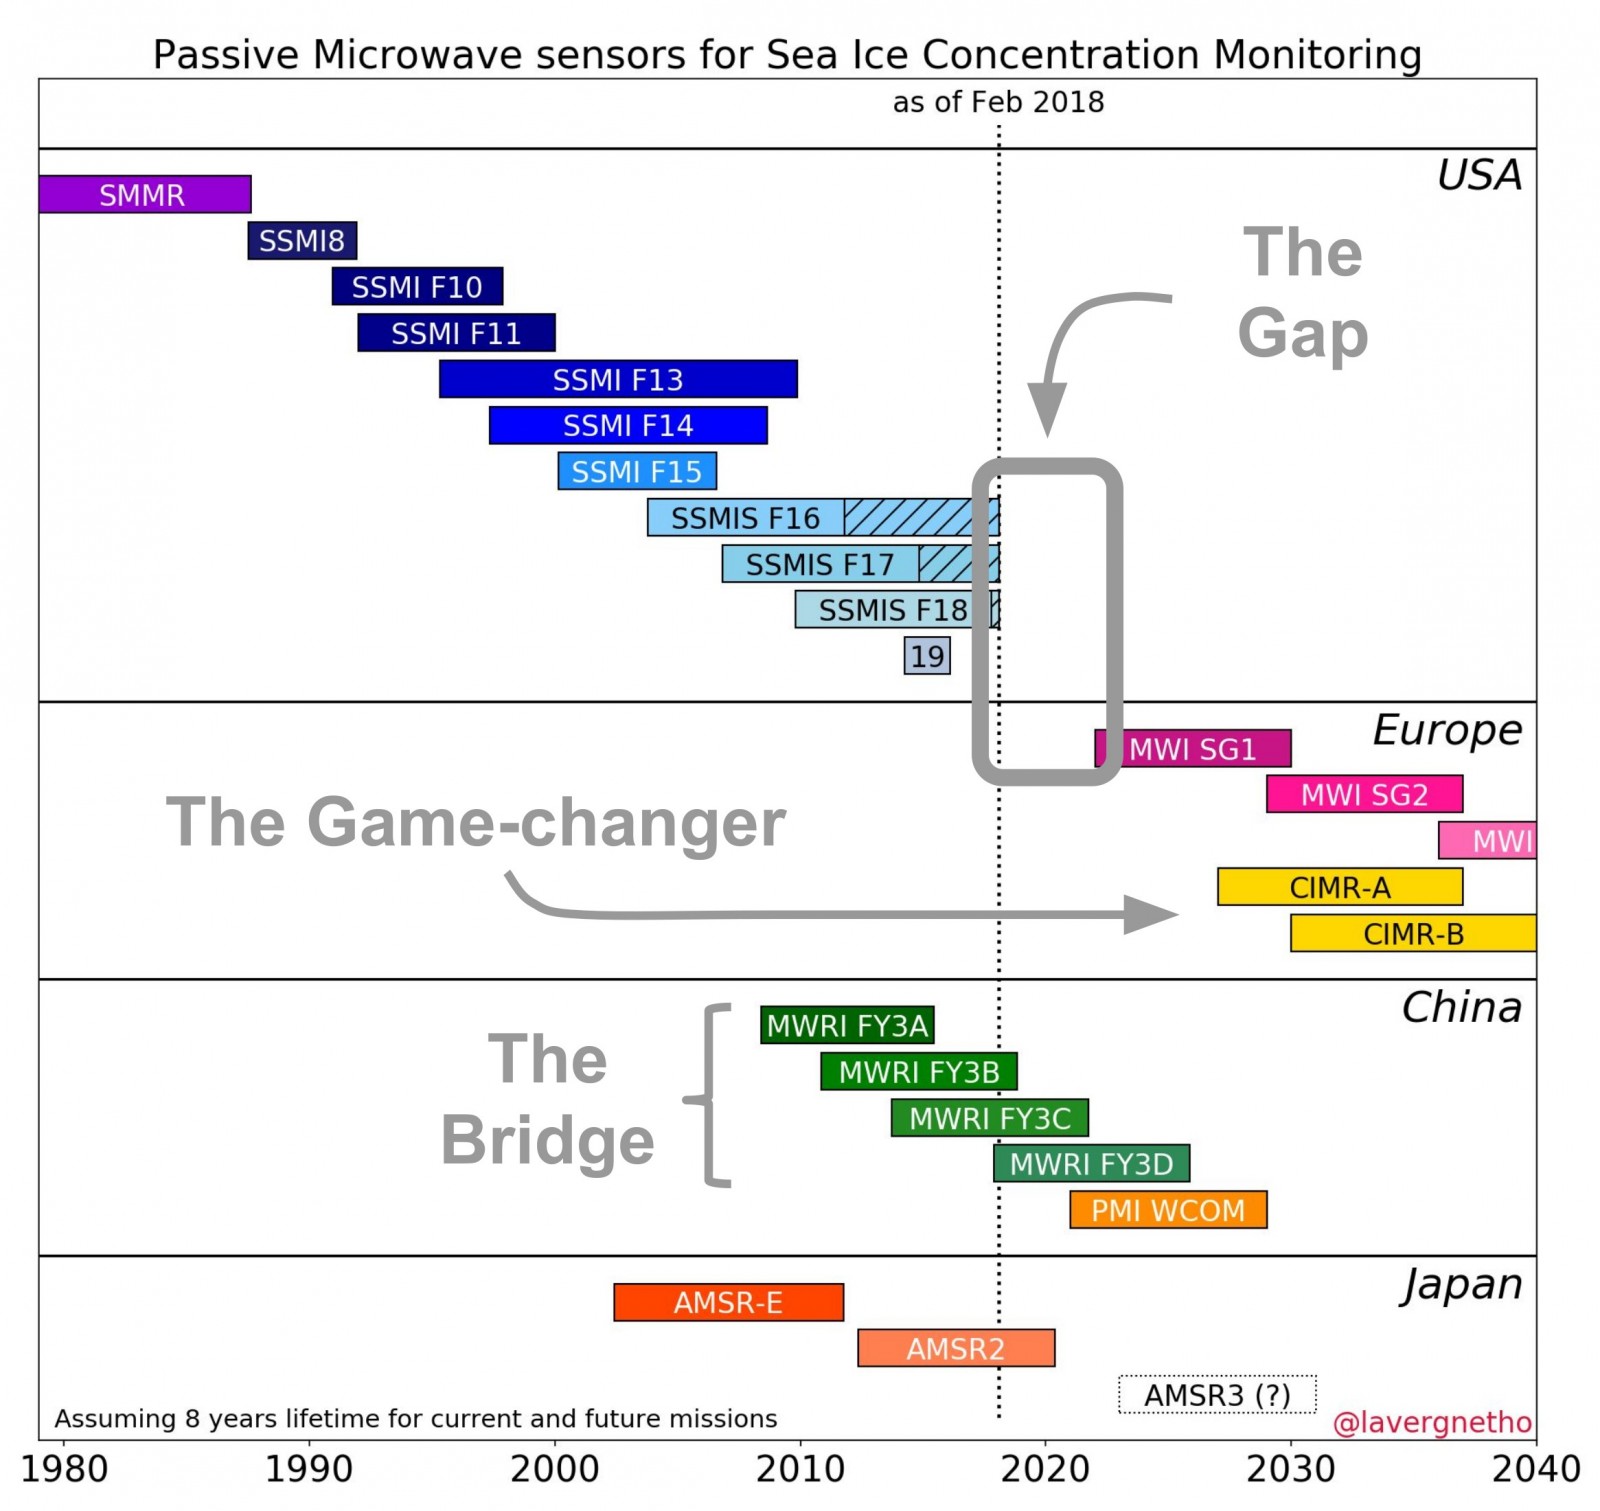
The Gap, the Bridge, and the Game-changer, together with many of the passive microwave satellite missions relevant for sea ice concentration mapping for the period 1980s to 2030s [Credit: T. Lavergne].
The Gap, the Bridge, and the Game-changer are three series of satellites. They carry instruments that measure the microwave radiation emitted by the Earth (called passive microwave instruments), while flying 800 km above our heads at 7,5 km/s. Since the late 1970s, most sea ice properties (concentration, extent, area, velocity, age and more!) have been measured with such passive microwave instruments.
So who are the Gap, the Bridge, and the Game-changer? Their story is what this Image of the Week is about…
The Gap
Since 1978, the U.S. equipped 11 satellites with passive microwave instruments to observe global sea ice. These instruments are called SMMR, SSM/I and SSMIS. Their measurements have produced a continuous, almost 40 year long climate data record of sea ice (see how satellite observations are converted into sea ice properties in this previous post). However, as described late last year in a Nature article, the remaining three of these instruments are ageing, already beyond their expected lifetime, and with no planned continuation from the U.S (see SSMIS F16-18 on our Image of the Week).
Europe will be operating a series of similar instruments (the MicroWave Imagers, MWI) on their 2nd Generation Polar System from 2023. A (looming future) gap is feared if the last U.S. instruments fail before the European ones are fully operating.
The decline of summer sea ice extent in the Arctic is an iconic indicator of climate change and U.S. satellites have enabled and sustained its monitoring for all these years (see this earlier post). More than a news magnet, the satellite time series is a back-bone for our understanding of the evolution of global sea ice. It is a key asset for developing and evaluating our climate models. The possibility of a data gap understandably caught the attention of the scientific community and the general public. This (looming future) «Gap» is the first character in our story.
The Bridge
The «Bridge» is known under the code name Feng Yun 3 (FY3) MWRI and is Chinese. The FY3 programme, operated by the Chinese Meteorological Administration (CMA), is a series of satellites with passive microwave instruments very similar to the ones on the American and European satellites. FY3D -the 4th satellite in the FY3 series- was successfully launched in late 2017, bridging the data gap that was feared to happen, even if the remaining U.S. SSMIS satellites would fail next month.
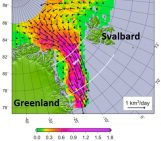
Over the past few months, scientists at the EUMETSAT OSI SAF (the European Organization for the Exploitation of Meteorological Satellites – Ocean and Sea Ice Satellite Application Facility) have been investigating the quality of FY3 passive microwave data. They adapted their algorithms to retrieve sea ice concentration from raw satellite measurements, so that they yield very similar accuracy to the sea ice concentration data they obtain from the SSMIS. An example sea ice concentration map using the OSI SAF algorithm on raw FY3 data is shown below. Such maps can extend the climate data record released in early 2017, should the last SSMIS fail.
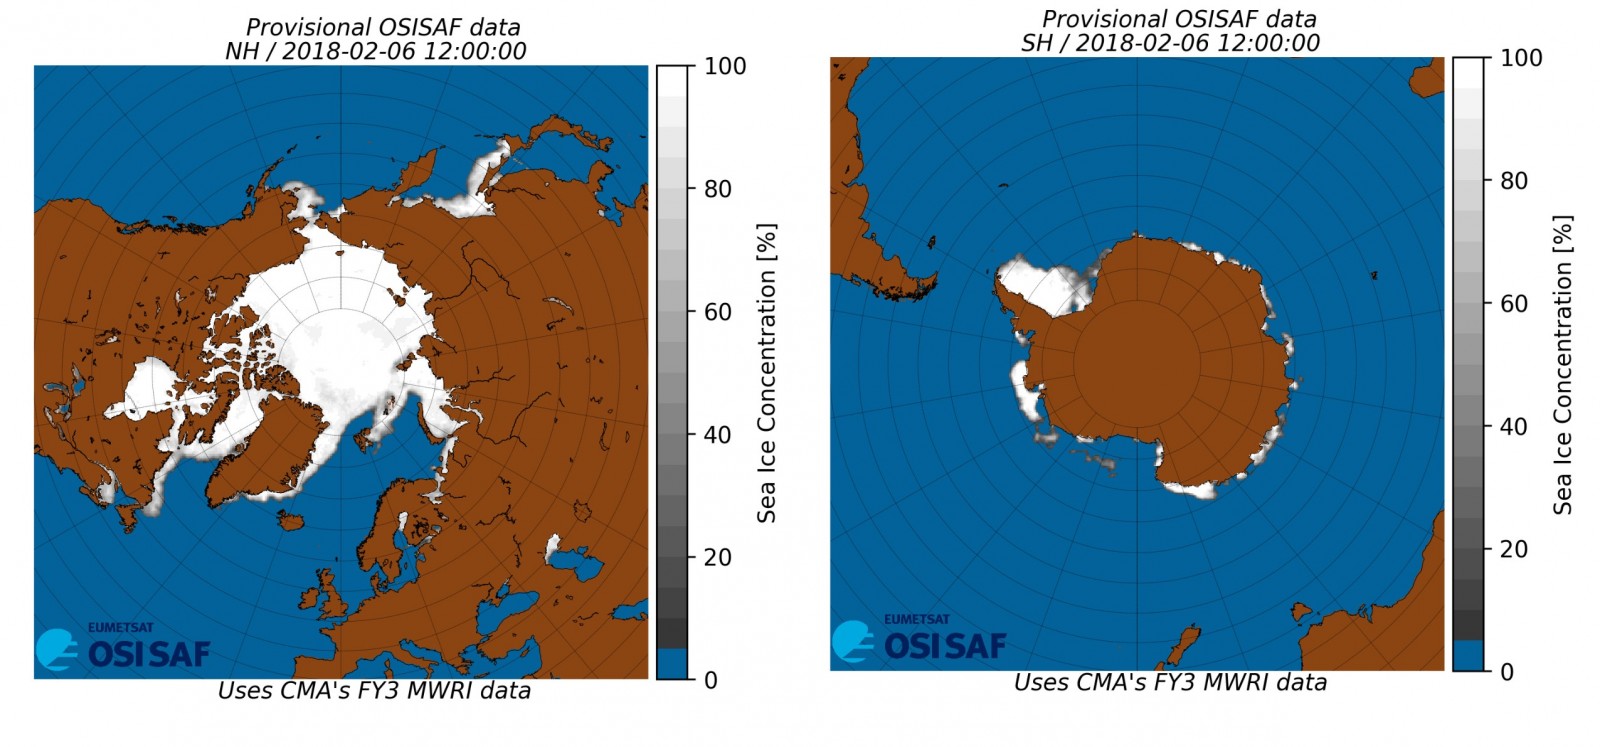
Sea Ice Concentration maps for February 6th 2018 (left: Northern Hemisphere, right: Southern Hemisphere). These are computed by the OSI SAF algorithms applied on raw FY3 MWRI data [Credit: A. Sørensen].
Access to the FY3 data was facilitated by bi-lateral agreements between EUMETSAT and CMA. National and international space agencies coordinate their activities in a variety of forums such as CEOS (Comittee on Earth Observation Satellites), CGMS (Coordination Group for Meteorological Satellites) or WMO PSTG (the World Meteorological Organization Polar Space Task Group) to cite a few. This global-scale coordination goes mostly unnoticed to the public and the scientific community. It is, however, a great aid for our ability to continuously monitor and predict the global environment.
You might think that, now that the Gap is Bridged, I have nothing more to tell you about passive microwave satellites for sea ice observations? Well, think again. There is a third character to our story: the «game-changer».
The Game-changer
Without further teasing you, our «game-changer» is CIMR. CIMR stands for the «Copernicus Imaging Microwave Radiometer». It might get selected for joining the family of Copernicus satellites some time in the late 2020s.
Before I tell you what makes CIMR so special, we need a short introduction on what passive microwave instruments are, why we like them for observing sea ice, and how they work:
T. Lavergne (2018) Passive Microwave Remote Sensing of Sea Ice : a crash-course in just four list items, Int. J. of Short Lists
The best satellite instruments for measuring sea ice use the microwave part of the electromagnetic spectrum (from ~1 to ~100 GHz). This type of radiation does not depend on Sun light, and is not blocked by clouds.
Passive microwave instruments record a tiny amount of radiation naturally emitted at the surface of the Earth and in the atmosphere. Aboard the satellite, the radiation is reflected by an antenna towards a recording instrument: the radiometer.
Radiometers can measure at several frequencies. Once the images are back at the processing centers on Earth, algorithms are applied to compute geophysical products such as sea ice concentration.
Radiometers with low frequencies (e.g. 6 GHz) yield best accuracy for sea ice concentration products. The bigger the antenna, the better the final resolution of the product.
One of a kind, the CIMR will focus on the low frequencies (6, 10, and 18 GHz), and fly an antenna big enough to ensure much better resolution than any of the passive microwave instruments we ever used before. This requires the antenna of CIMR to be substantially larger than that of SSMIS (60cm diameter), MWI (75cm) or even AMSR2 (2.1m)! The AMSR-E instrument and its followers were game-changers 15 years ago, and still offer the best resolution today… but future operational models and polar applications will require better sea ice products all too soon.
An exciting time opens for satellite-based observations of polar sea ice, as the pre-studies for CIMR are started by the European Space Agency this spring! Will industry take-up the challenge and build a big enough antenna for CIMR? Will CIMR be selected as EU’s future polar Copernicus mission? If “yes” to both, Europe will have a game-changer: high-resolution all-weather daily global accurate mapping of sea ice concentration.
I will definitely follow the developments with CIMR! Maybe I’ll tell you how it went in a future blog post? 🙂
Note: Were there too many acronyms in this blog? Well, we are sorry about that. Those satellite-people just LOVE their acronyms! A good resource for searching what satellite acronyms mean is the “Space capability” page from the World Meteorological Organization: https://www.wmo-sat.info/oscar/spacecapabilities (enter the acronym in the Quick Search, top-right for the page).
Further reading
- Ageing satellites put crucial sea-ice climate record at risk, Nature, 551, (Nov 2017).
- On selecting sea ice concentration algorithms: Ivanova, N. et al.: Inter-comparison and evaluation of sea ice algorithms: towards further identification of challenges and optimal approach using passive microwave observations, The Cryosphere, 9, 1797-1817, 2015.
- “Hot” news: Year 2018 starts with a new Northern Hemisphere record low sea ice extent for January, report by NSIDC.
Edited by David Docquier and Clara Burgard
 Thomas Lavergne is a research scientist at the Norwegian Meteorological Institute. His main interest is in improving algorithms to improve sea ice satellite products, and help towards a better understanding between observation and model communities. He recently worked with EUMETSAT OSI SAF and ESA CCI to produce Climate Data Records for Sea Ice Concentration. He tweets as @lavergnetho.