In the last fifty years, models and observations have enabled us to better understand sea-ice processes. On the one hand, global climate models have been developed, accounting for the sea-ice component in the climate system. On the other hand, satellite instruments have been developed to monitor the “real” sea-ice evolution. These satellite observations are often used to evaluate climate models. However, lately, doubts have arisen to whether comparing model output to observations is the most reasonable method. Are we sometimes comparing oranges to apples? To discuss this matter, sea-ice modelers and sea-ice observers met over three days in Hamburg earlier this month at the Workshop on improved satellite retrievals of sea-ice concentration and sea-ice thickness for climate applications.
How do we measure past and current sea–ice changes?
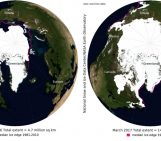
The great advantage of satellites over in-situ measurements is that they measure changes in sea-ice concentration (fraction of ocean covered by sea ice in a given area) and sea-ice thickness in a continuous way with an almost complete spatial coverage of the polar regions (see this previous post) and with a high temporal resolution.
Of course, satellites do not directly measure sea-ice concentration. Rather, they measure the brightness temperature (left part of Fig. 2), which is a measure of the radiation emitted by the Earth’s surface and atmosphere, with passive microwave sensors (such as SSM/I). From this brightness temperature, it is possible to compute sea-ice concentration (see this article for further information). Microwave sensors are used because they can “see” the surface through clouds and during polar night, which is not possible with visible sensors (such as MODIS).
In a similar way, satellites do not directly measure sea-ice thickness. Rather, they measure sea-ice freeboard (right part of Fig. 2), i.e. the height of the ice above the sea surface, with different kinds of sensors (laser altimetry [e.g. ICESat], radar altimetry [CryoSat]). Sea-ice thickness is then retrieved through appropriate algorithms (see e.g. this article).
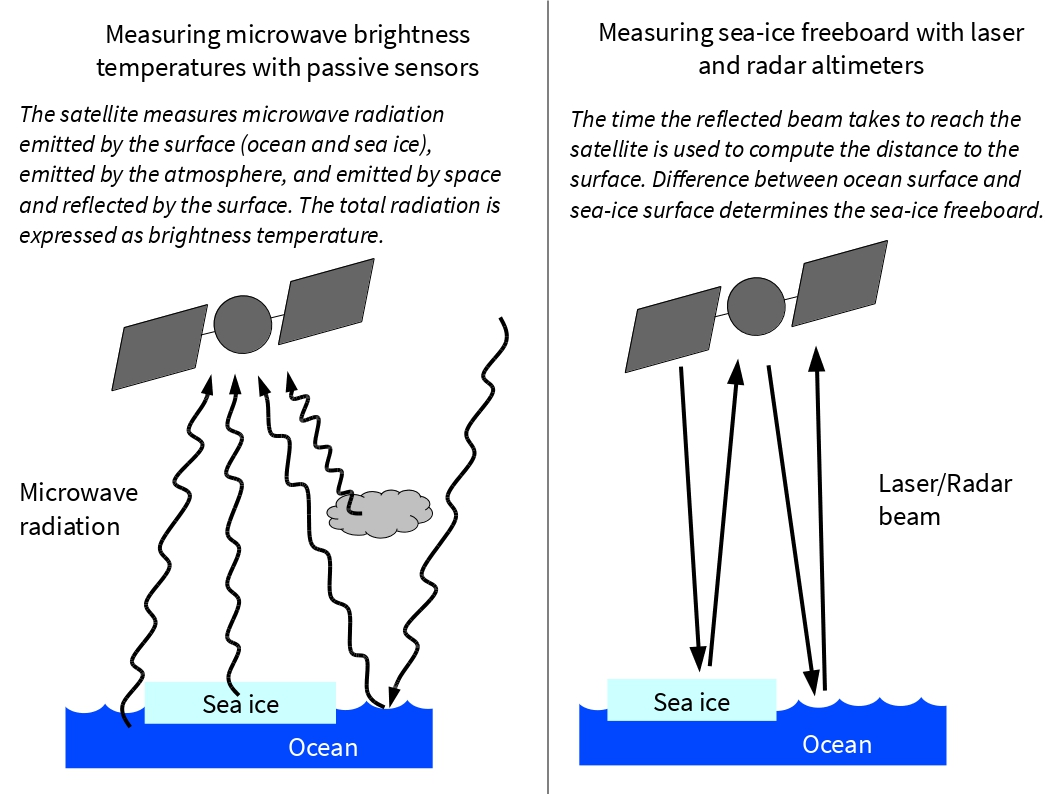
Fig. 2: Satellite measurement techniques that lead to the observed brightness temperatures and sea-ice freeboard [Credit: C. Burgard].
Are the satellite retrievals accurate?
Each method of deriving sea-ice concentration or thickness from satellite measurements has its own uncertainties. For example, algorithms to retrieve sea-ice concentration use several assumptions about the state of the atmosphere and surface emissivity. Also, melt ponds and thin ice show up as lower concentration regions. Similarly, different assumptions about snow depth on ice and about sea-ice density impact the retrieved sea-ice thickness. Therefore, the sea-ice variables retrieved from satellite observations may deviate from their actual “real” state.
How do we project future sea-ice changes?
In order to project the future sea-ice evolution, different climate models are used (see this article for example). These climate models are usually evaluated against satellite observations in order to assess their performance. While all models present biases compared to observations, it cannot always be concluded that this is necessarily a problem of the models as observations also have uncertainties as previously said. Therefore, the main discussions at the workshop in Hamburg (Fig. 3) were about reducing uncertainties in the comparison between observations and models.
How can we better compare satellite observations and models?
The discussion in Hamburg was very lively as modelers and observers exchanged about how they actually reach the results they provide, explaining in detail their models and algorithms. It became rapidly clear that comparing observed sea-ice concentration to modeled sea-ice concentration might be like comparing apples to oranges under certain circumstances.
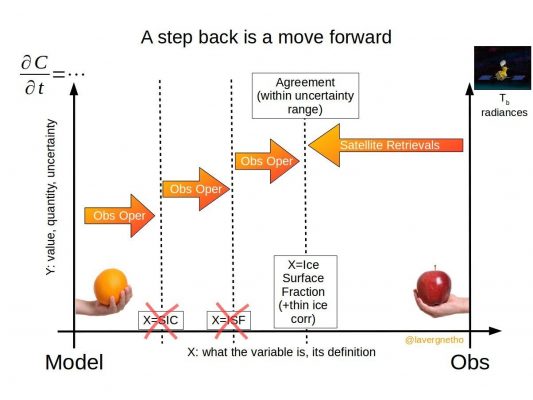
Thomas Lavergne, a researcher at the Norwegian Meteorological Institute, gave a presentation related to this discussion by presenting the picture that is our Image of the Week. The classical method up to now has always been to transform the measured satellite signal into a “satellite product”, a quantity that is directly computed by models (direction from right to left in the Image of the Week), so that we can compare this quantity to the corresponding model variable. As already mentioned, this can lead to assumptions and introduce errors into the observations, while one would expect observations to be the best representation of the “real” world.
Another possible approach, already well accepted in the community of weather forecasting, is to transform the model variables all the way into simulated brightness temperatures and compare these to satellite data (direction from left to right in the Image of the Week). The algorithms that transform model variables into simulated satellite quantities are observation operators. Although an active field of research, the observation operators for sea ice are not ready, and the comparison of sea-ice simulations to satellite observations will for the foreseeable future rely on satellite “products”.
At the workshop, Lavergne advocated for a middle-ground solution, where satellite products “take a step back” and climate models “take a step forward” using tailored observation operators. This would reduce the need for assumptions in the satellite products but still be manageable for modelers, and would most likely offer the best consensus for the two communities. This way, observed and modeled quantities can still be compared with each other and uncertainties introduced into the comparison can be reduced.
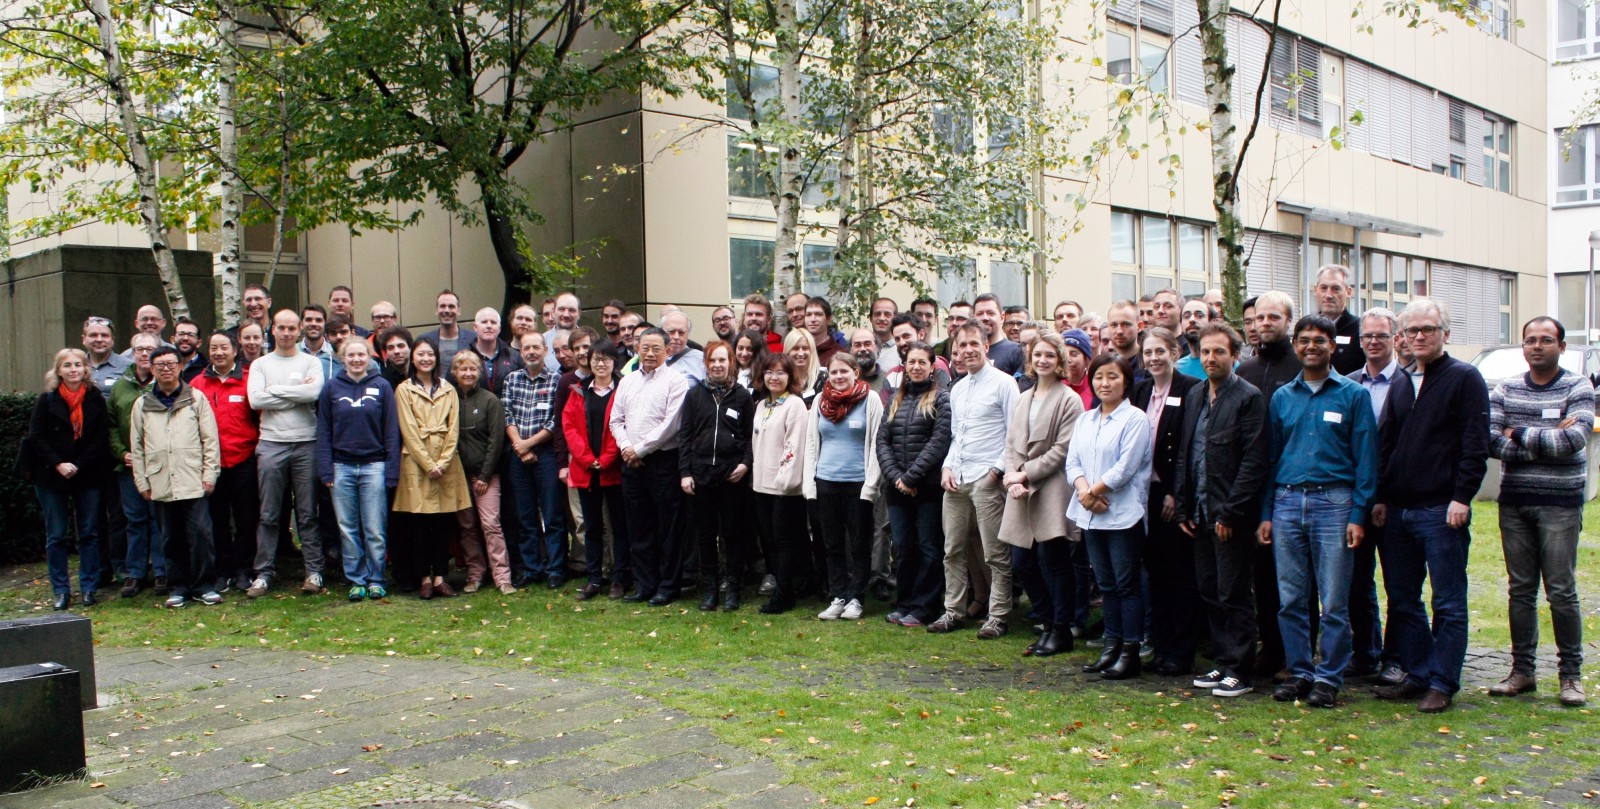
Fig. 3: Happy sea-ice observers and sea-ice modelers in Hamburg [Credit: Julika Doerffer, CEN, Universität Hamburg]
Perspectives
The workshop aim was to bring together sea-ice observers and modelers. While no real consensus on the proposed approach was found, the reflection has been launched and probably deserves some more attention in the future in order to better compare sea-ice models and satellite observations. This might move the debate from an apple-to-oranges comparison to a pear-to-pear one. This will hopefully improve sea-ice models and satellite observations and improve future projections of sea-ice evolution.
Further reading
- Ivanova, N. et al. (2015). Inter-comparison and evaluation of sea ice algorithms: towards further identification of challenges and optimal approach using passive microwave observations , The Cryosphere, 9, 1797-1817, doi: 10.5194/tc-9-1797-2015.
- Kwok, R. et al. (2009). Thinning and volume loss of the Arctic Ocean sea ice cover: 2003–2008 , Journal of Geophysical Research, 114, C7, doi: 10.1029/2009JC005312.
- Lavergne, T. (2017). A step back is a move forward , figshare, https://doi.org/10.6084/m9.figshare.5501536.v1, Retrieved: 24/10/2017.
- Massonnet, F. et al. (2012). Constraining projections of summer Arctic sea ice, The Crysophere, 6, 1383-1394, doi: 10.5194/tc-6-1383-2012.
- Workshop website
With contributions by Thomas Lavergne and Clara Burgard
Edited by Clara Burgard and Sophie Berger
 David Docquier is a post-doctoral researcher at the Earth and Life Institute of Université catholique de Louvain (UCL) in Belgium. He works on the development of processed-based sea-ice metrics in order to improve the evaluation of global climate models (GCMs). His study is embedded within the EU Horizon 2020 PRIMAVERA project, which aims at developing a new generation of high-resolution GCMs to better represent the climate.