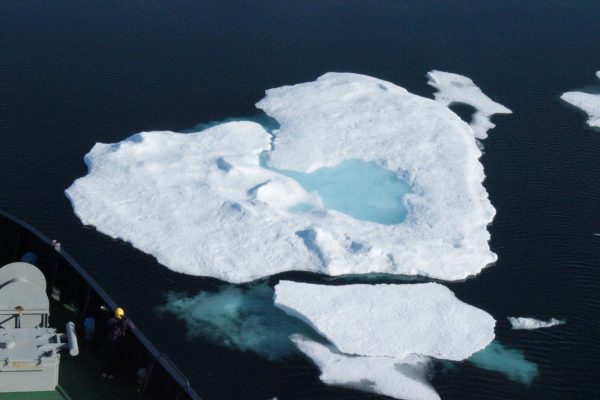
“Positive feedback” is a term that regularly pops up when talking about climate change. It does not mean good news, but rather that climate change causes a phenomenon which it turns exacerbates climate change. The image of this week shows a beautiful melt pond in the Arctic sea ice, which is an example of such positive feedback.
What is a melt pond?
The Arctic sea ice is typically non-smooth, and covered in snow. When, after the long polar night, the sun shines again on the sea ice, a series of events happen (e.g. Fetterer and Untersteiner, 1998):
-
the snow layer melts;
-
the melted snow collects in depressions at the surface of the sea ice to form ponds;
-
these ponds of melted water are darker than the surrounding ice, i.e. they have a lower albedo. As a result they absorb more heat from the Sun, which melts more ice and deepens the pond. Melt ponds are typically 5 to 10 m wide and 15 to 50 cm deep (Perovich et al., 2009);
-
eventually, the water from the ponds ends up in the ocean: either by percolation through the whole sea-ice column or because the bottom of the pond reaches the ocean. Sometimes, it can also simply refreeze, as the air temperatures drop again (Polashenski et al., 2012).
Melt ponds cover 50-60% of the Arctic sea ice each summer (Eicken et al., 2004), and up to 90% of the first year ice (Perovich al., 2011). How do we know these percentages? Mostly, thanks to satellites.
Monitoring melt ponds by satellites
Like most phenomena that we discuss on this blog, continuous in-situ measurements are not feasible at the scale of the whole Arctic, so scientists rely on satellites instead. For melt ponds, spectro-radiometer data are used (Rösel et al., 2012). These measure the surface reflectance of the Earth – i.e. the proportion of energy reflected by the surface – for wavelengths in the visible and infrared (0.4 to 14.4 μm). The idea is that different types of surfaces reflect the sunlight differently, and we can use these data to then map the types of surfaces over a region.
In particular for the Arctic, sea ice, open ocean and any stage in-between all reflect the sunlight differently (i.e. have different albedos). The way that the albedo changes with the wavelength is also different for each surface, which is why radiometer measurements are taken for a range of wavelengths. With these measurements, not only can we locate the melt ponds in the Arctic, but even assess how mature the pond is (i.e. how long ago it formed) and how deep it extends. These values are key for climate change predictions.

Fig. 2: Melt pond seen by a camera below the sea ice. (The pond is the lighter area) [Credit: NOAA’s climate.gov]
Melt ponds and the climate
Let’s come back to the positive feedback mentioned in the introduction. Solar radiation and warm air temperature create melt ponds. The darker melt ponds have a higher albedo than the white sea ice, so they absorb more heat, and further warm our climate. This extra heat is also transferred to the ocean, so melt pond-covered sea ice melts three times more from below than bare ice (Flocco et al., 2012). This vicious circle heat – less sea ice – more heat absorbed – even less sea ice…, is called the ice-albedo feedback. It is one of the processes responsible for the polar amplification of global warming, i.e. the fact that poles warm way faster than the rest of the world (see also this post for more explanation).
The ice-albedo feedback is one of the processes responsible for the polar amplification of global warming
But it’s not all doom and gloom. For one thing, melt ponds are associated with algae bloom. The sun light can penetrate deeper through the ocean under a melt pond than under bare ice (see Fig. 2), which means that life can develop more easily. And now that we understand better how melt ponds form, and how much area they cover in the Arctic, efforts are being made to include more realistic sea-ice properties and pond parametrisation in climate models (e.g. Holland et al., 2012). That way, we can study more precisely their impact on future climate, and the demise of the Arctic sea ice.
Edited by Sophie Berger
Further reading
-
Arctic melt ponds form when meltwater clogs ice pores | Science Daily
-
Arctic Melt Pond | NASA Visible Earth
-
September Arctic sea-ice minimum predicted by spring melt-pond fraction | Dr Michel Tsadamos personal webpage
Pingback: Cryospheric Sciences | Climate Change & Cryosphere – Why is the Arctic sea-ice cover retreating?