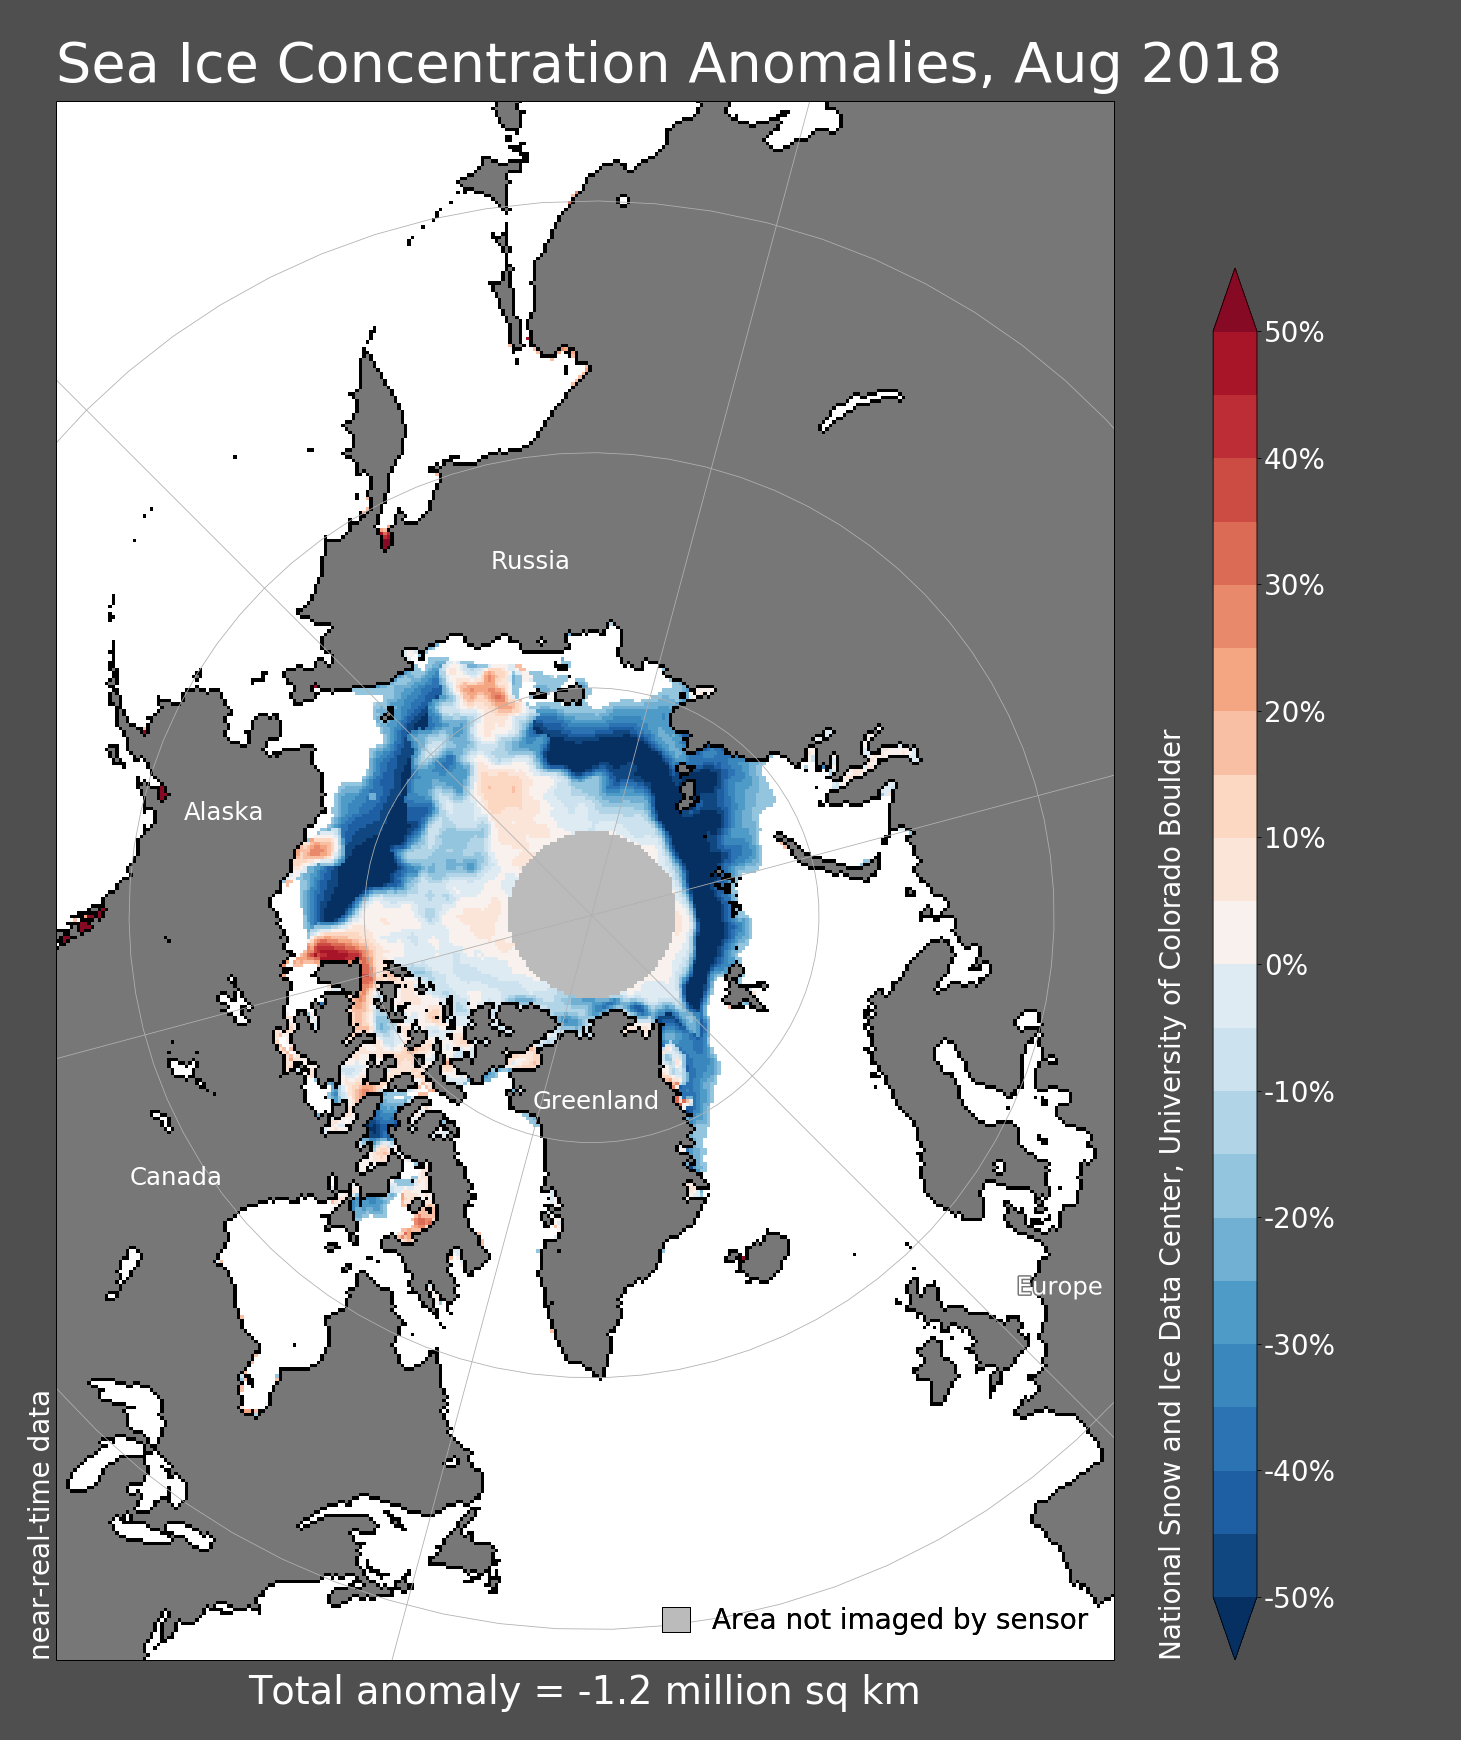
Sea ice concentration anomaly for August 2018: blue means less ice than “normal”, i.e. 1981-2010 average. Credit: NSIDC.
With the equinox this Sunday, it is officially the end of summer in the Northern hemisphere and in particular the end of the melt season in the Arctic. These last years, it has typically been the time to write bad news about record low sea ice and the continuation of the dramatic decreasing trend (see this post on this blog). So, how bad has the 2018 melt season been for the Arctic?
Yes, the 2018 summer Arctic sea ice was anomalously low
Before we give you the results for this summer, let us start with the definitions of the three most common sea ice statistics:
- Sea ice concentration: how much of a given surface area (e.g. 1 km2) in the ocean is covered by sea ice. The concentration is 100% if there is nothing but sea ice, 50% if half of this area is covered by ice, and 0% if there is nothing but open water. Read more about how satellites measure sea ice concentration on this blog here.
- Sea ice extent: typically defined as the ocean area with at least 15% sea ice concentration.
- Sea ice volume: the whole volume of sea ice, i.e. total area times thickness of sea ice. This is probably the most difficult of the three statistics to measure since satellite measurements of sea ice thickness are only starting to be trustworthy.
So, how did summer 2018 perform regarding these three statistics?
As shown on today’s Image of the Week, the sea ice concentration has been anomalously low in most parts of the Arctic, with many areas in dark blue showing they had more than 50% less sea ice than normal (1981-2010 average).
The resulting extent was anomalously low as well (see figure below), but not record-breaking low. The volume however was the fourth lowest recorded or 50% lower than normal, with 5000 km3 of sea ice missing. In a more meaningful unit, that is one trillion elephants of ice, or 64 000 elephants per km2 of the Arctic Ocean.
But as we discussed in a previous post, talking about the Arctic as a whole is not enough to understand what happened this summer. So let us have a closer look at the area north and east of Greenland.
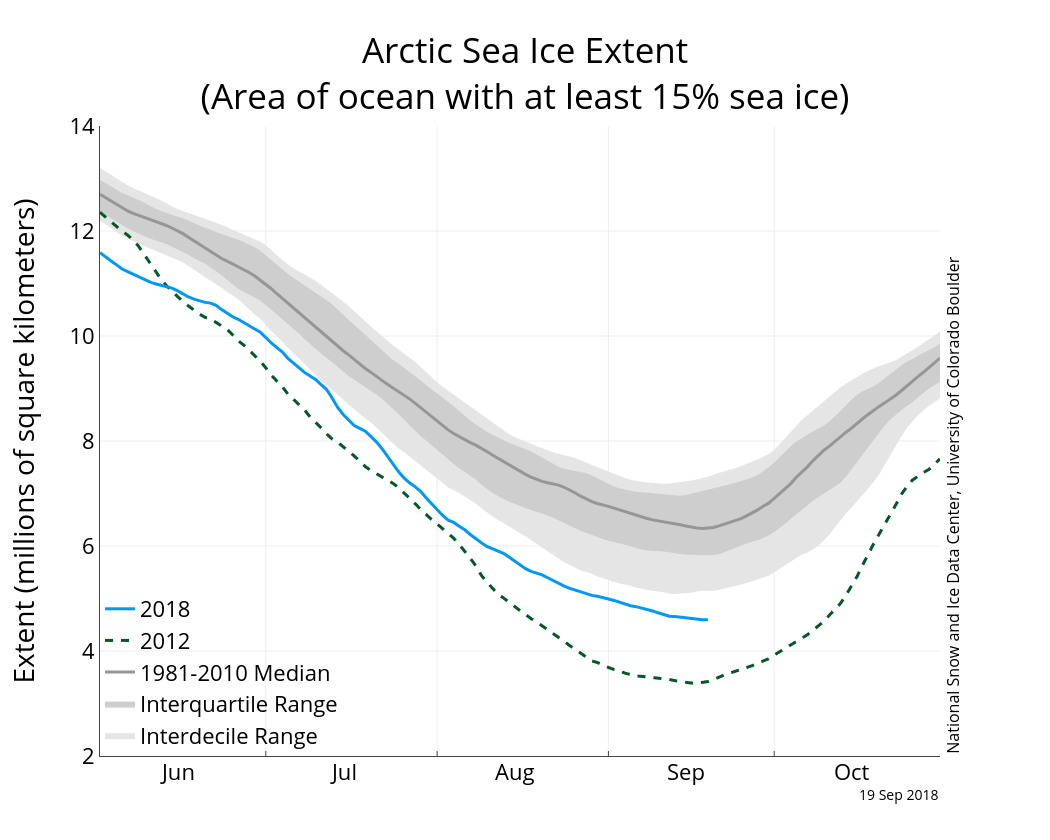
Summer 2018 Arctic sea ice extent up till 19th September (blue) compared to the “normal” extent (grey) and the all-time record of 2012 (green dashed). Credit: NSIDC.
North of Greenland: open water instead of multiyear ice
Until recently, most of the Arctic Ocean was covered by multiyear / perennial ice. That is, most sea ice would not melt in summer and would stay until the next winter. But with climate change and the warming of the Arctic, the multiyear ice cover has shrunk and became limited to the area north of Greenland.
The situation has been even more dramatic this summer. For the entire month of August 2018, there was open water north of Greenland where there should have been thick multiyear ice (see picture below). As nicely explained here, that area had already unexpectedly melted in February this year when the Arctic was struck with record high air temperatures; when the sea ice closed again, it was thinner and more brittle than it should have been, and did not withstand strong winds in August. Therefore, this unusual winter melting could have contributed to the formation of open water north of Greenland.
It is really bad news, and it does feel like yet another tragic milestone: even the last areas of multiyear ice are melting away. Most worryingly, we do not know what the consequences of this disappearance will be on the ecosystem and the entire climate. Or rather, we know that everything from local sea ice algae to European weather patterns will be affected, but more research is needed over the coming years before we can assess the full impact over our complex fully coupled climate system.
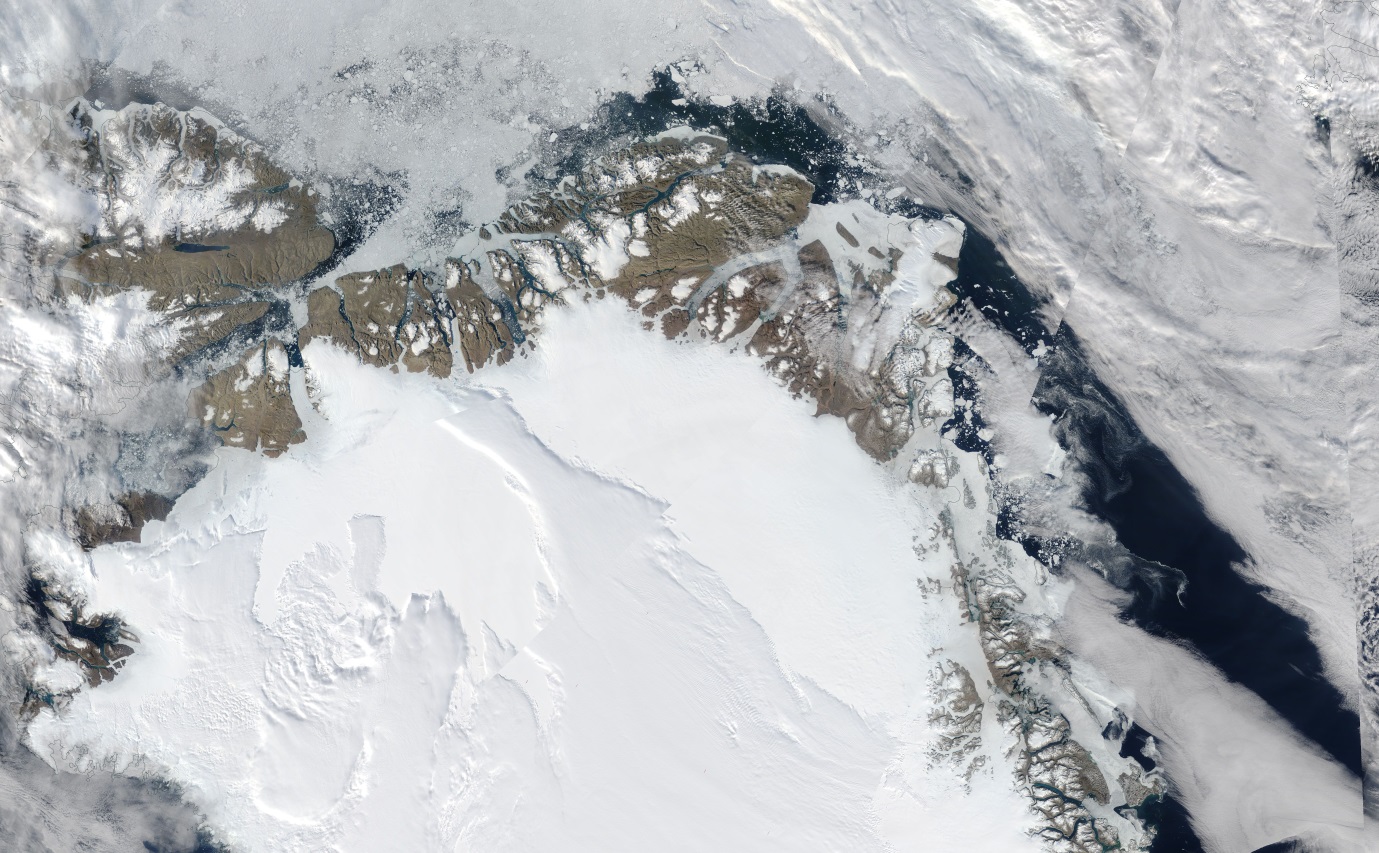
Optical satellite image of the northern half of Greenland, 19 August 2018. Dark colour is open water, and should not have been here. Credit: NASA.
Reference/Further reading
For near real time analysis of the sea ice conditions: https://nsidc.org/arcticseaicenews/
For checking sea ice data from home: https://seaice.uni-bremen.de/databrowser/
For simple visualisations of sea ice statistics: http://sites.uci.edu/zlabe/arctic-sea-ice-volumethickness/
Edited by David Docquier