The first week of the Climate Change summit in Bonn (COP 23 for those in the know) has been marked by Syria’s decision to sign the Paris Accord, the international agreement that aims at tackling climate change. This decision means that the United States would become the only country outside the agreement if it were to complete the withdrawal process vowed by President Trump.
In this context, it has become a tradition for this blog to use the United Nations climate talks as an excuse to remind us all of some basic facts about climate change and its effect on the part we are most interested in here: the cryosphere! This year we have decided to showcase a few compelling animations, as we say “a picture is sometimes worth a thousand words”…
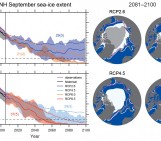
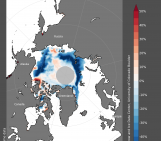
Arctic sea ice volume
Daily Arctic sea ice volume is estimated by the PIOMAS reconstruction from 1979-present [Credit: Ed Hawkins]
More information about Arctic sea ice:
- PIOMAS Arctic Sea Ice Volume Reanalysis | Polar science center
- Arctic Sea Ice Minimum | NASA: Climate Change and Global Warming
- Image of the Week – The ups and downs of sea ice! | EGU Cryoblog
Land ice losses in Antarctica and Greenland
Change in land ice mass since 2002 (Right: Greenland, Left: Antarctica). Data is measured by NASA’s Gravity Recovery and Climate Experiment (GRACE) satellites. [Credit: Zack Labe]
Both the Antarctic and Greenland ice sheets have been losing ice since 2002, contributing to global sea-level rise (see previous post about sea level) . An ice loss of 100 Gt raises the sea level by ~0.28 mm (see explanations here).
More information about ice loss from the ice sheets:
- Land Ice | NASA: Climate Change and Global Warming
- Image of the Week — Ice Sheets and Sea Level Rise | EGU Cryoblog
The cause: CO2 emissions and global warming
Finally we could not close this post without showing how the concentration of carbon dioxide have evolved over the same period and how this has led to global warming.
CO₂ concentration and global mean temperature 1958 – present. [Credit:Kevin Pluck]
More information about CO2 and temperature change
- Global Temperature | NASA: Climate Change and Global Warming
- Carbon dioxide | NASA: Climate Change and Global Warming
More visualisation resources
Visualisation resources | Climate lab
Edited by Clara Burgard