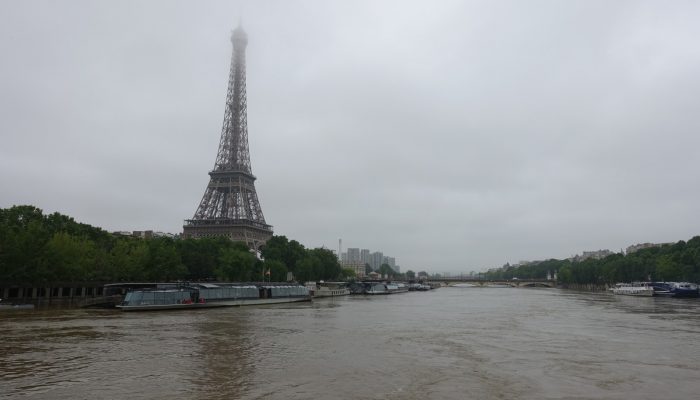
In June 2016, Paris was transformed. The River Seine burst its banks, submerging some of the nearby roads; floodwater lapped at the tops of street lamps and traffic lights. The event marked the the worst flooding in Paris for more than 30 years.
When a flood event hits a major city, numerous researchers are keen to collect data for their work. However, Rosa Vicari, a PhD student at the the École des Ponts ParisTech Laboratory of Hydrology, Meteorology and Complexity, was interested in a rather different kind of data. Vicari harvests web communications during and after extreme weather events to analyse how journalists and the public at large perceive these phenomena.
“The objective of my research is to investigate the point of view of different stakeholders on the same issue i.e. urban resilience to climate related risks,” explains Vicari. “The idea is to identify topics that are often discussed together by the media, and which stakeholders are associated with specific topics, because we can see that there are some recurring clusters.”
She first collates press articles on weather events from a French online journalism database; 753 of them in the case of the 2016 Paris floods. Vicari then employs the open source software Gargantext (A. Delanöe, D. Chavalarias, 2016) to select more than 300 frequently used terms from the articles, including words such as ‘tourists’, ‘insurance’, or ‘environment minister’. Over time, she refines her selections to create a standard list that she can apply to different flooding case studies.
Gargantext then gathers together key terms that are used concurrently to create a network. “The software looks at how many times two words appear in the same set of articles,” says Vicari. “If two words frequently appear together, they will be grouped in the same cluster. Each node is a key term and the connections between the nodes indicate that [the words] co-occur in the same article.” From this analysis, Vicari can isolate the main actors and issues from a media perspective, the opinion-formers and hot topics, to see if they coincide with those that interest other stakeholders, policy-makers and scientists for example.

A network representation of key terms from 753 French press articles covering the 2016 Seine river flood. Based on this network representation it is possible to identify six different clusters, corresponding to six different stages of urban risk management. (Image Credit: Rosa Vicari)
From examining the 2016 flooding event, Vicari and her thesis advisors, were able to find a connection between the river’s condition and the media coverage. “The day when media attention is highest is exactly the same day as when the river discharge is the highest. There is a correlation between the environmental phenomenon and the media impact.”
This might not sound surprising, but it means that the media coverage is centered on the physical weather event itself, rather than the human response and recovery. Indeed, other studies have suggested that a press focus on the physical side of disasters, especially through the use of inappropriate or shocking images, draws attention away from relief efforts and future resilience. Sometimes, in the case of climate change-related hazards, the negative coverage demotivates the public from taking action.
Vicari also compared her results from the Seine with the October 2015 Alpes-Maritimes flood in the French Riviera, which experienced a different kind of media coverage. “The flood in the southeast of France was less visible in the media,” says Vicari, “but the impact in terms of human victims was huge.” With the network representation, Vicari could see that the large number of victims in the Alpes-Maritimes flood had swamped the media, whilst the physical features of the flood did not receive as much attention.
Interestingly, though, Twitter has proved less useful than media articles as a way of ascertaining the main issues at play. Vicari has a hypothesis as to why this is so. “[Twitter] does not include complex discussion… it often includes links to external web pages,” she says.
“Tweets that concern flood risk, or other climate-related risks, are really focussed on [a] description of the risk during the emergency. They refer to the location and time of the flood; it is very factual information.” Twitter does not, by itself, provide sufficient space for an in-depth engagement with extreme weather. However, unlike the press articles, “Twitter is very good to see how different users interact with each other,” continues Vicari.
Vicari can complete her analysis in about a day, presenting the possibility for near real-time feedback on the public and media perception of an evolving weather event. This information about the social construction of reality could enable decision makers to better interact with the public during and after extreme weather events.
For example, some of the deaths during the Alpes-Maritimes flood could have been prevented if the public had known that it was unsafe to drive. On longer timescales, a coordinated digital communications strategy could help to garner support for new initiatives such as green roofs. Similar analysis would also allow scientists to measure the impact of their own outreach activities.
In the future, Vicari hopes to see further collaboration between scientists from different disciplines on the one hand and urban communities on the other. “Media is storytelling, and of course it will influence people’s perceptions,” she says. By following these digital trails, diverging perceptions of climate risks and resilience solutions for our cities can be highlighted and then acted upon.
By Tim Middleton, EGU 2018 General Assembly Press Assistant
References
Vicari, R. et al.: Extreme weather, digital media, and big data: following communication trails to investigate urban communities resilience, Geophys. Res. Abstr., 20, EGU2018-10859, 2018 (conference abstract)
Hydrology, Meteorology, and Complexity, École des Ponts ParisTech
The Chair Hydrology for Resilient Cities, École des Ponts ParisTech


