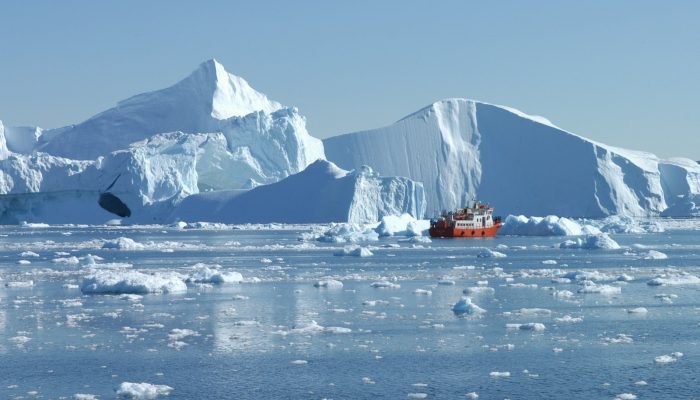
The Greenland ice sheet is undergoing rapid change, and nowhere more so than at its margins, where large outlet glaciers reach sea level. Because these glaciers are fed by very large reservoirs of ice, they don’t just flow to the coast, but can extend many kilometres out into the ocean. Here, the ice – being lighter than water – will float, but remain connected to the ice on the mainland. This phenomenon is called an ice shelf or, if it is confined to a relatively narrow fjord, an ice tongue. Ice shelves currently exist in Antarctica as well as in high Arctic Canada and Greenland.
Ice shelves already float on the ocean so that their melting does not affect sea level, but they are a crucial part of a glacier’s architecture. The mass of an ice shelf, as well as any contact points with fjord walls, mean that it acts as a buttress for the rest of the glacier, slowing down its flow speed and stabilising it. When ice shelves melt, therefore, this can lead to the whole glacier system behind them flowing faster and thus delivering more land-based ice to the ocean.
Ice shelves lose mass as icebergs calve off at their seaward end, and through melting on their surface – but, unlike glaciers on land, they are with the ocean below. This ice-ocean interface is an important source of melting for a number of glaciers in northern Greenland; instead of the large volume of icebergs produced by many glaciers further south, the large ice tongues reaching into the ocean mean that a lot of ice is instead lost through submarine melting.
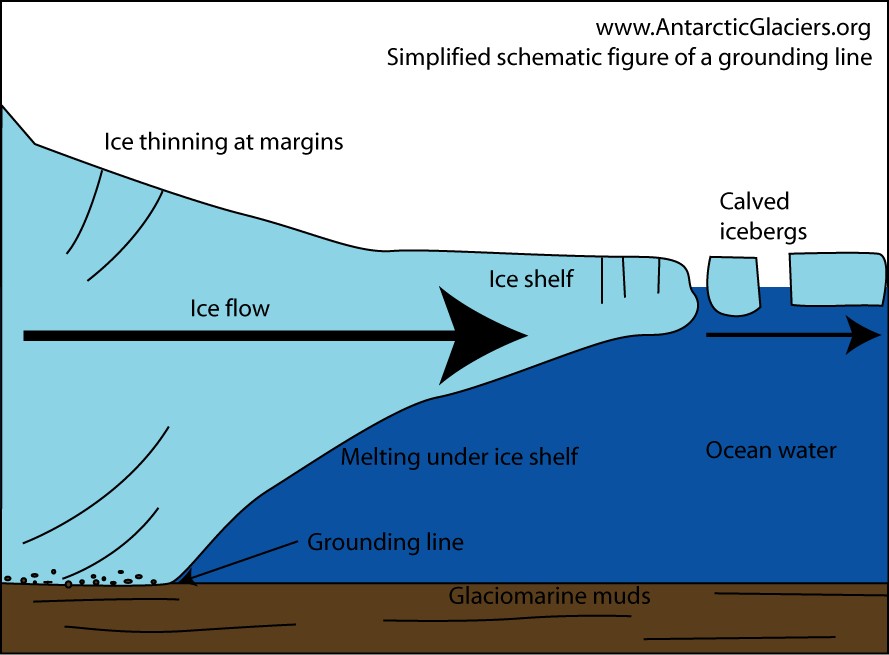
Simplified schematic of a grounding line. By Bethan Davies (distributed via AntarcticGlaciers.org).
This ice-ocean interface is an environment that was, until recently, very difficult to accurately observe and study, and accordingly there is relatively little data on the impact of submarine melting on ice shelves. But the changes that take place here, at the ice-ocean interface, can have important implications for the entire glacier system, as well as for the ice sheet as a whole.
Over the last 30 years, a number of Arctic ice shelves and ice tongues have dramatically shrunk or disappeared entirely. In the Canadian Arctic, the Ellesmere ice shelf broke up into a number of smaller shelves over the course of the 20th century, most of which are continuing to shrink. In Greenland, meanwhile, the dramatic retreat of the Jakobshavn Glacier’s ice tongue during the 2000s has been particularly well documented.
The largest remaining ice tongues in Greenland are now all located in the far north of the island. But even here, at nearly 80°N and beyond, ice tongues are changing rapidly. Warming air temperatures probably play a role in this development, but submarine melting is thought to be the key driver of these rapid changes.
Submarine melting of ice tongues thus appears to be an important variable in ice-sheet dynamics. A new study in the EGU’s open access journal The Cryosphere has now used satellite imagery to produce a detailed map of submarine melt under the three largest ice tongues in northern Greenland. They are the ones belonging to Petermann and Ryder Glaciers in far northwestern Greenland and 79N Glacier – named after the latitude of its location – in the northeast of the island. Each of these ice shelves extends dozens of kilometres from where the glacier stops resting on bedrock and begins to float (the so-called grounding line) and is up to several hundred metres thick.
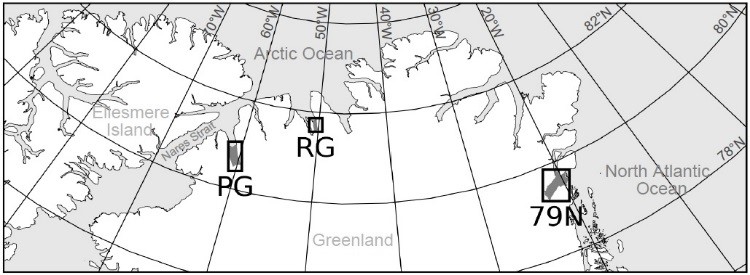
The locations of Petermann (PG), Ryder (RG) and 79N Glaciers in northern Greenland. From Wilson et al. (2017).
Previous attempts to estimate submarine melt rates relied on an assumption of steady state: that the ice shelf is becoming neither thicker nor thinner. Given the recent changes in all these ice shelves and the glaciers above them, this is not a tenable assumption in this case. Petermann and Ryder Glaciers, in particular, have recently experienced large calving events that were probably related to unusual melt patterns under the waterline.
Lead author Nat Wilson, a PhD student at MIT and Woods Hole Oceanographic Institution, and his colleagues used satellite images spanning four years to create a number of digital elevation models of the Petermann, Ryder and 79N ice shelves. A digital elevation model, or DEM, is a three-dimensional representation of a surface created – in this case – from satellite-based elevation data. By comparing DEMs from different points in time to each other, the team could deduct changes in the height – and therefore volume – of the ice shelves. This method also allowed them to track visible features of the glaciers between images from different years, providing estimates of how fast the ice was flowing down into the ocean.
However, using digital elevation models in a marine setting is not always a straightforward matter. Tides can affect the elevation of ice shelves by a significant amount, especially as the distance from the grounding line increases, and their effect needed to be accounted for in the results. Similarly, the team had to account for the changes on the surface of the ice shelf, where snowfall and melting can affect its volume.
What Wilson and his colleagues were left with was a map of melt rates across the ice shelves. In some respects, the findings were unsurprising. Melt rates were greatest near the coast, where the ice shelves were thickest, because at these points they would be in contact with the ocean at depths of several hundred metres. At such depths, fjords around Greenland often contain warm, dense water that flows in from the continental shelf and contributes to rapid ice melt. As the ice shelves thin towards their outer edges, they are in contact with shallower, colder water that doesn’t melt the ice as quickly.
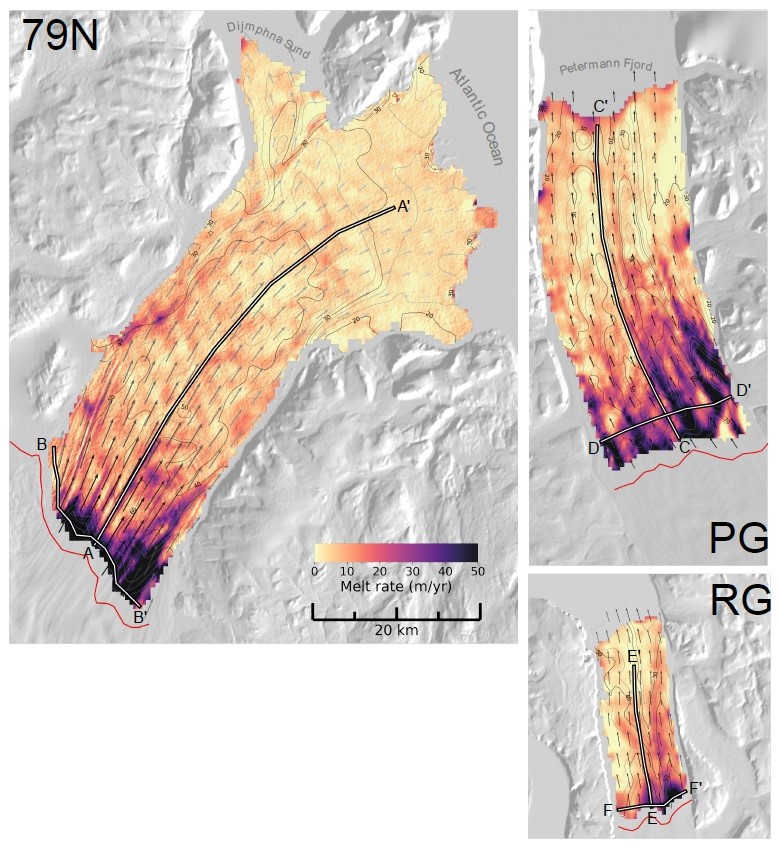
Submarine melt rates at Greenland’s largest ice tongues are shown in colour shading; the arrows show the direction of ice flow. PG – Petermann Glacier; RG -Ryder Glacier. From Wilson et al. (2017).
All three ice shelves lost between 40-60m per year to submarine melting at their thickest points, while this decreased to about 10m per year in thinner sections. This equates to billions of tonnes of ice melting in contact with the ocean. Each of the ice shelves lost at least five times as much ice to melting underwater than to melting on the surface. This highlights what an important contribution submarine melting makes to the mass balance of Greenland’s ice shelves, and that this remote environment is deserving of our interest and study.
The team found that at Ryder Glacier’s ice shelf, mass loss from melting (from both above and below) is not significantly greater than the amount of ice entering the ice shelf from land: the ice shelf appears to be relatively stable for the time being. The situation is similar at Petermann Glacier, although its ice shelf has been in rapid retreat and lost some 250 km in the decade leading up to 2010. With the extra submarine melting from that area, melting would likely have exceeded incoming ice! It remains to be seen whether Petermann Glacier and its ice shelf will stabilise in their new configuration.
Finally, at 79N Glacier, the results indicate the ice shelf is losing mass faster than it is replenished from upstream. The ice tongue loses some 1.3% of its mass to melting each year – and that’s before iceberg calving is included in the equation. This finding is consistent with satellite imagery that suggests that the ice shelf at 79N has been thinning in recent decades.
This new study shows that there is considerable variability in submarine melting of ice shelves, both in space and in time. 79N glacier’s ice shelf – the biggest one remaining in Greenland – exhibited the highest mass deficit in this study, suggesting that we may see major changes in this glacier in future. With this type of melt making up for the bulk of mass loss of northern Greenland’s ice shelves, its accurate prediction plays an important role in understanding how these huge glaciers – and the whole ice sheet itself – will change in coming years.
By Jon Fuhrmann, freelance science writer
References
Wilson, N., Straneo, F., and Heimbach, P.: Satellite-derived submarine melt rates and mass balance (2011–2015) for Greenland’s largest remaining ice tongues, The Cryosphere, 11, 2773-2782, https://doi.org/10.5194/tc-11-2773-2017, 2017.
Hodgson, D. A. First synchronous retreat of ice shelves marks a new phase of polar deglaciation. Proc. Natl. Acad. Sci. U. S. A. 108, 18859-18860, doi:10.1073/pnas.1116515108 (2011).
Münchow, A., L. Padman, P. Washam, and K.W. Nicholls. 2016. The ice shelf of Petermann Gletscher, North Greenland, and its connection to the Arctic and Atlantic Oceans. Oceanography 29(4):84–95, https://doi.org/10.5670/oceanog.2016.101.
Reeh N. (2017) Greenland Ice Shelves and Ice Tongues. In: Copland L., Mueller D. (eds) Arctic Ice Shelves and Ice Islands. Springer Polar Sciences. Springer, Dordrecht. https://doi.org/10.1007/978-94-024-1101-0_4
Truffer, M., and R. J. Motyka, Where glaciers meet water: Subaqueous melt and its relevance to glaciers in various settings, Rev. Geophys., 54, 220– 239. doi:10.1002/2015RG000494, (2016)


Yusup
Comments: University of Cambridge Forum
https://www.thenakedscientists.com/forum/index.php?topic=73127.0
Юсуп
The tides are the result of the rotation of the Earth and the whirlpools.
There is a strict pattern; tides are formed, not across the coast of the seas and oceans, but only on those coasts where the high angular velocity of the currents. And the higher the velocity of currents, the higher the amplitude of the tidal wave. On the rectilinear coasts, where the currents do not have angular velocity, tides and ebbs do not form.
The waters of lakes, seas and oceans of the northern hemisphere rotate counterclockwise, while the waters of the southern hemisphere rotate clockwise, forming giant whirlpools.
As is known, everything that rotates, including whirlpools, has the property of a gyro (yule) to maintain the vertical position of the axis in space, regardless of the rotation of the Earth.
If you look at the Earth from the side of the Sun, the whirlpools, spinning with the Earth, capsize twice a day, thanks to which the whirlpools precess (swing by 1-2 degrees) and reflect the tidal wave around the perimeter of the whirlpool. http://goo.gl/AM5g1s
The waters of the White Sea rotate counter-clockwise, forming a huge whirlpool-gyroscope, which, precessing, reflects a tidal wave along the entire perimeter of the White Sea.
A similar pattern of tides and ebbs is observed in all lakes, seas and oceans.
http://tapemark.narod.ru/more/22.png
The waters of the Mediterranean Sea rotate counter-clockwise, forming tides, 10-15 cm high. But in Gabes Bay, “what?” Off the coast of Tunisia, the height of the tides reaches three meters, and sometimes more, and this is considered one of the mysteries of nature. But at the same time, in the Bay of Gabes the whirlpool turns, precessing the reflecting additional tidal wave ?.
A tidal wave in the Amazon River creates a huge planetary maelstrom a few thousand kilometers in diameter, rotating between South America and North Africa, embracing the mouth of the Amazon River.
The scheme of motion of a tidal wave, along the perimeter of the North Atlantic planetary maelstrom. https://youtu.be/ZEhm_ONTQKc
The length of the tidal wave depends on the diameter of the whirlpool. And the height of the tidal wave depends on the speed of rotation of the whirlpool of the orbital velocity of the Earth, and the time of the tilting of the whirlpool (12 hours).
A = V1 • V2 / t
where: A is the amplitude of the tidal wave (precession angle).
V1 – rotation speed of the whirlpool.
V2 is the orbital velocity of the Earth.
t – the time of tilting of the whirlpool (12 hours).
The vortex theory of tides can be easily verified from the connection of the height of the tidal wave with the rotation speed of the whirlpools. The height of the tidal wave can determine the location of the whirlpools. Drawing on a map of the depths and currents of the seas and oceans.
Continuation: Forum NIYA MEPhI. The theme of “Tides and ebbs is the result of the rotation of the Earth and whirlpools.” https://mephi.ru/communication/forum/talk/forum13/topic5498/messages/
Юсуп
The seasonal increase in water level of the seas and oceans.
http://www.oceanographers.net/forums/showthread.php?5631-The-seasonal-increase-in-water-level-of-the-seas-and-oceans
The ebb and flow – the result of the Earth’s rotation and whirlpools.
http://ramana-studypoint.blogspot.ru/2011/07/moon-tides-what-causes-them_13.html?m=1