There is no doubt that the Arctic is currently losing its sea ice as our climate is warming. And this process will carry on as temperatures continue climbing. But the rate at which sea ice will melt in the future and the exact date when the Arctic will be free of sea ice is not known due to several factors (which will be briefly discussed in this post). Torben Koenigk and I have selected climate models that are closest to observations in order to reduce uncertainties in the future projections of Arctic sea ice. And the main result is that an ice-free Arctic could be much closer than expected…
The future decline of Arctic sea ice…
As already explained in previous posts, we know that sea ice (i.e. frozen ocean water) in the Arctic Ocean has been retreating at a fast pace since the beginning of satellite observations, with a stronger decline in summer compared to winter (see this post for the link with ocean heat transport, this post for a summary of the IPCC Special Report on the Ocean and Cryosphere in a Changing Climate [SROCC], this post for the large melt event of summer 2018, this post for Arctic changes and this post for seasonal and regional differences in sea ice). As we are not soothsayers, less is known about the future of Arctic sea ice, even if we can make assumptions based on the extrapolation of observations (see this post) or, better, using climate models (see this post).
If we use the latest model projections from the Coupled Model Intercomparison Project Phase 6 (CMIP6, see this post), which have been used to produce the results presented in the last IPCC report (Working Group 1 of the Sixth Assessment Report), we can estimate the future evolution of Arctic sea ice. As said in our introduction, a relatively large uncertainty in climate projections exists. This uncertainty is a combination of three different sources:
- uncertainty associated with the emission scenarios: we simply don’t know how much greenhouse gases we will emit in the future;
- uncertainty linked to climate models: climate models, although relatively complex, constitute an idealized representation of the climate system on Earth, and thus many processes (like cloud formation) need to be simplified;
- uncertainty linked to climate internal variability (see this post): this is the variability caused by the chaotic nature of the climate system, which for example makes some years exceptionally warm or exceptionally cold compared to the background trend.
The first source of uncertainty (emissions) can be reduced by running the same climate model several times with different emission scenarios. In Figure 2 below, we show the future evolution of Arctic sea-ice area in September (when sea-ice area is at its minimum) from two different emission scenarios. The upper panel (a) shows the results for a low-emission scenario. In this case, we can see that the sea-ice area averaged over all models, named the ‘multi-model mean’ and represented by the thick black curve, decreases by about 2 million km2 between 2015 and 2060 and then stays relatively constant until the end of the century. The lower panel (b) shows the results for a high-emission scenario. In the latter scenario, the reduction in sea-ice area is stronger: the Arctic becomes almost ice free (sea-ice area below 1 million km2, see this post) in September 2061 and the sea-ice area reaches about 0.5 million km2 at the end of the century, so 4 times lower than the low-emission scenario (thick black curve in Figure 2b).
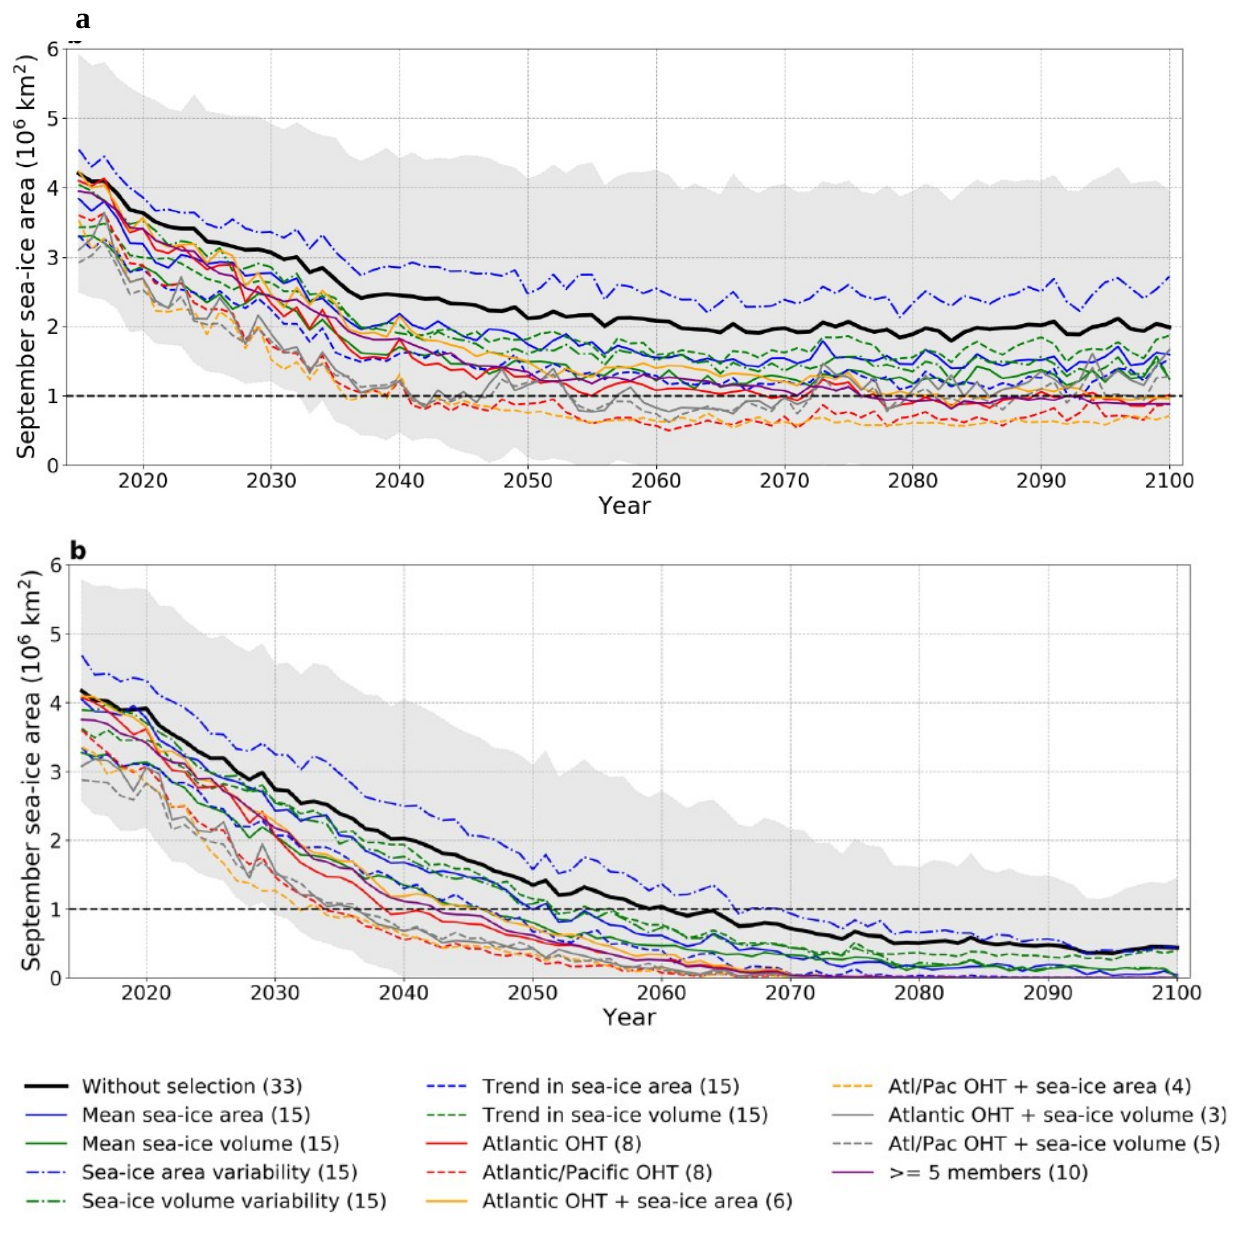
Figure 2: Time evolution of September Arctic sea-ice area from 2015 to 2100 based on CMIP6 model projections and using a low (panel a, SSP1-2.6) and a high (panel b, SSP5-8.5) greenhouse gas emission scenario. The black curve is the multi-model mean averaged over all models (the model spread is indicated with light gray shading) and the colored curves show the multi-model means with specific selection criteria. The number of models included in each multi-model average is indicated in parentheses in the legend. The horizontal dashed line outlines the ice-free Arctic threshold. Figure credit: Figs. 2b and S4b of Docquier & Koenigk (2021)
The third source of uncertainty (internal variability) is partly taken into account in the results presented in Figure 2 by averaging over all model simulations, although the number of simulations per model could still be increased to further reduce this uncertainty (see this post for a brief description of how ensemble members can be created).
… could be faster than anticipated
“What? He forgot the second source of uncertainty (climate models)…” No, it’s just that this is where our study, carried out with the help of Torben Koenigk, comes into play. Some climate models better represent one specific aspect of the present climate (Arctic sea ice in our case) than others, when we compare them to observations. We can argue that these models thus provide more accurate future projections of this specific aspect (sea ice).
So, in order to reduce the uncertainty linked to climate models, we selected the climate models that were closest to observations over the recent past (1979-2014) using a variety of criteria based on sea-ice area, sea-ice volume (roughly sea-ice area times thickness) and ocean heat transport. Using this methodology, we found a faster future decline in Arctic sea-ice area compared to the average over all models. This is reflected in Figure 2, where each colored curve is the multi-model mean based on a different selection criterion: we can see that most of the colored curves are below the multi-model mean without selection (the thick black curve) in both emission scenarios (panels a and b).
To further summarize these results, we plotted the date when the September Arctic sea-ice area goes below 1 million km2 (the so-called ‘ice-free Arctic’) for the first time for the case without model selection (black dot in Figure 3) and for 13 different selection criteria (colored dots and crosses in Figure 3). We found that, in the high-emission scenario, the Arctic could be almost ice free around 2050 using model selection based on sea-ice area and volume only (blue and green dots and crosses in Figure 3), and around 2035 using model selection based on ocean heat transport (combined or not with sea-ice area and volume; red, orange and gray dots and crosses in Figure 3). The latter date is especially scary as this is 26 years earlier than the multi-model mean without selection (2061) and in 14 years from now.
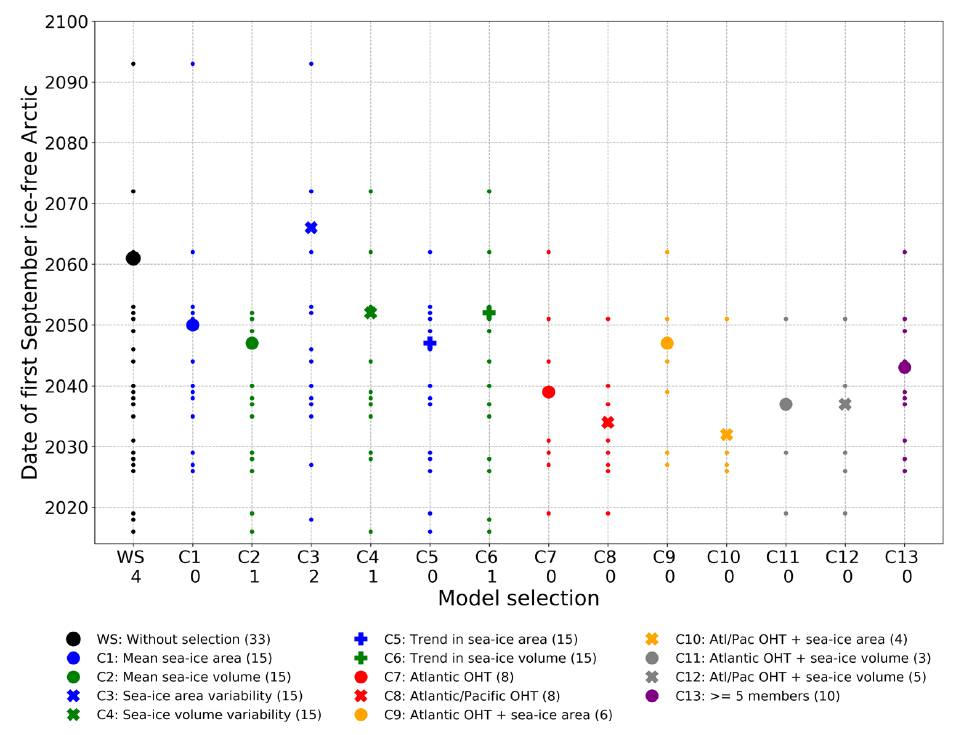
Figure 3: Date of first September ice-free Arctic in CMIP6 models (year when September sea-ice area drops below 1 million km2 for the first time) for the different selection criteria (C1-C13) and without selection (WS), based on the high greenhouse gas emission scenario (SSP5-8.5). The larger symbols show the dates of the multi-model means, while the small dots show the dates of the individual models. The number of models that do not reach ice-free conditions before the end of the century is indicated below the labels on the X axis. The number of models included in each multi-model average is indicated in parentheses in the legend. Figure credit: Fig. 4 of Docquier & Koenigk (2021)
In the low-emission scenario, although the Arctic does not warm as much as in the high-emission scenario, it could be almost ice free as soon as around 2040 based on ocean heat transport selection criteria, and not before the end of the century based on sea-ice criteria only.
Thus, our results highlight a potential underestimation of future Arctic sea-ice loss when we take into account all CMIP6 models. A careful selection of climate models that have a mean climate state closer to sea-ice and ocean heat transport observations provides an earlier ice-free Arctic.
But it is not too late
This relatively uncomfortable result does not mean that we should accept the idea that sea ice will be totally gone in a few years or decades. As already explained and shown in Figure 2, the future of Arctic sea ice strongly depends on the emission scenario we will follow. Thus, every single change we make at the level of our governments, industries, communities or households in order to reduce our carbon footprint is important and will slow down the decline of Arctic sea ice.
Further reading
- Study that describes these results in details: Docquier & Koenigk (2021). ‘Observation-based selection of climate models projects Arctic ice-free summers around 2035’. Communications Earth & Environment, https://doi.org/10.1038/s43247-021-00214-7
- Blog post about this study: Docquier (2021). ‘Model selection shows earlier ice-free Arctic than anticipated’. Behind the Paper blog post for Springer Nature Sustainability Community
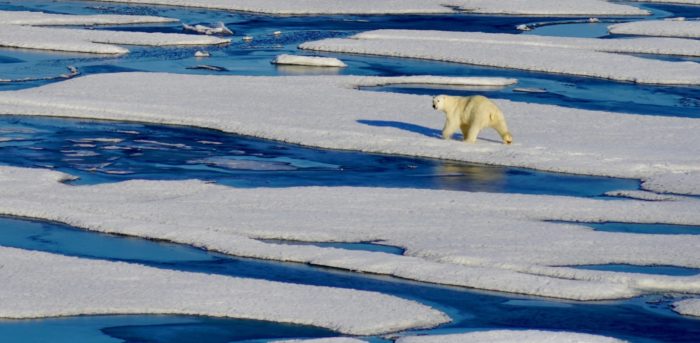
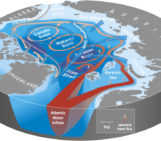
- Image of the Week – The ups and downs of sea ice! (C. Burgard)
Edited by Marie Cavitte
 David Docquier is a post-doctoral researcher at the Royal Meteorological Institute of Belgium. His study focuses on the interactions between the ocean and atmosphere using tools from nonlinear sciences. His work is embedded within the JPI-Oceans/JPI-Climate ROADMAP project.


Todd Saucier
Good day,
My question is probably a bit tough to answer but I was wondering… how long it will take for the latent heat that melted the ice to warm the water enough to stop or completely disrupt the AMOC.
Also I was wondering about the level of ocean rise associated not with ice but simple change of water depth just from expansion due to increased water temperature.
In addition, even if we get less than a foot or so in the next couple to five years I believe this might have a deliterious effect on the thwaites glacier as its bed sits far below sea level and warmer water is already chewing away at the bed line and it has retreated significantly. Higher sea level there might float the toe of thwaites higher and lift the bed allowing water under it and releasing it no?
It seems that with so many positive feedback loops already well under way (Fires in siberia and temps there now getting to 100 F and melting permafrost etc.) that we may be looking at ways to survive the changes as opposed to stopping them.
David Docquier
Hi Todd,
Thank you for your questions and your interest in the post. Here are my answers to your questions:
1) Indeed, when sea ice melts, it absorbs latent heat in order to go from solid to liquid state, but this process does not result in a change in its temperature (https://link.springer.com/referenceworkentry/10.1007/1-4020-3266-8_124). Once all the ice (of a given ice pack) has melted, the extra energy added to the system will warm the ocean. So it is not the latent heat itself that warms the ocean, but rather the rising temperatures. As for the AMOC disruption, observations show that the AMOC has been weakening since the mid-20th century (https://www.nature.com/articles/s41612-021-00182-x) and model projections show that it will continue to slow down (https://www.ipcc.ch/report/ar6/wg1/downloads/report/IPCC_AR6_WGI_Chapter_09.pdf), though a stop is not foreseen in the near future. This AMOC weakening is due to both surface warming and addition of freshwater (via ice melting).
2) Sea-level rise is due mainly due to the melting of land ice (i.e. ice sheets and glaciers), and to the thermal expansion of the ocean (via ocean warming), which is the process you mention here. However, sea ice (which is frozen ocean and is the topic of this post) does not strongly affect the sea level when melting since it already floats onto the ocean. You can find more information about the exact numbers of the different contributions to sea-level rise in the IPCC reports, and I particularly recommend this page: https://www.ipcc.ch/report/ar6/wg1/downloads/faqs/IPCC_AR6_WGI_FAQs.pdf (see FAQ9.2).
3) You mention Thwaites Glacier, but this post is not about glaciers and ice sheets, but about sea ice. I recommend an earlier post: https://blogs.egu.eu/divisions/cr/2020/03/13/whats-up-on-thwaites-glacier/.
4) To your question of whether we should try to “survive the changes” instead of “stop the changes”, I think that we are trying to do the two things right now, namely “adaptation” and “mitigation”. I suggest that you have a look at Working Group 2 of the IPCC for Adaptation (https://www.ipcc.ch/working-group/wg2/) and Working Group 3 of the IPCC for Mitigation (https://www.ipcc.ch/working-group/wg3/).
Thanks,
David