You have probably heard the name “Intergovernmental Panel on Climate Change (IPCC)” mentioned frequently over the last few years. The IPCC is the United Nations body for assessing science related to climate change and it publishes global assessment reports on this topic every 5 to 10 years. Due to the current urgency of the global climate crisis and the need for more information by decision makers, the IPCC decided to publish several smaller more “special” reports between its fifth (published in 2013/2014) and sixth (planned for 2021/2022) assessment reports. The Special Report on the Oceans and the Cryosphere in a changing Climate (short “SROCC”) was published about a month ago. In this blog post, we will give you an overview of the take-home messages about the fate of the cryospheric elements of our planet – those parts which are frozen!
Why is there a special report about ocean and cryosphere?
Discussions about global warming are often centered around changes in air temperature and changes in places where people live. The cryosphere and the ocean are, by contrast, remote areas without dense human population. However, climate change has a high impact on the cryosphere and oceans and this, in turn, has an effect on places where people live, one prominent example of this being land loss due to sea-level rise. Less talked about but equally impactful, is thawing permafrost, leading to high carbon release to the atmosphere, and melting Arctic sea-ice cover, enhancing Arctic Amplification, which can influence climate in mid-latitudes and globally.
The Special Report on Oceans and the Cryosphere in a changing Climate (SROCC) has the aim of highlighting the links between oceans, cryosphere and sea-level rise to improve policy makers’ understanding of these key elements and of the interdependencies between them (see Fig. 2). This is particularly critical at present, as the 25th Conference of Parties (COP25), organized by the United Nations Climate Change Convention, will be happening in around one month’s time in Santiago de Chile.
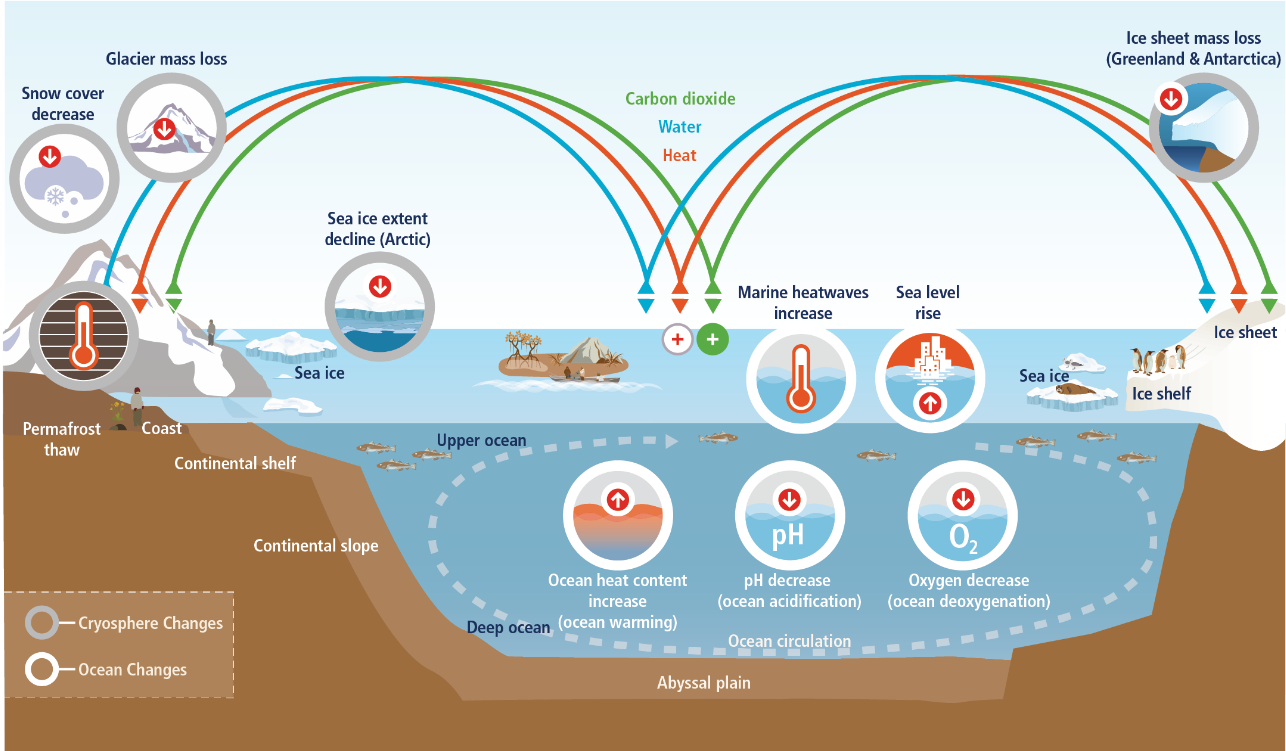
Fig. 2: Summary of the changes discussed in the IPCC Special report on the Oceans (white circles) and the Cryosphere (grey circles) under Climate Change [Credit: Box 1, Figure 1 in SROCC].
The Special Report is based on peer-reviewed literature from natural sciences, social sciences and humanities. It represents the most current scientific view on the oceans and the cryosphere. But what exactly are the conclusions of this report and why is it important? This post will guide you through the key points relevant to the cryosphere: permafrost, snow cover, glaciers and ice sheers, and sea ice!
Info box: What is an RCP scenario?

In IPCC reports, the projections for the future climate evolution are conducted using scenarios for the future greenhouse gas emissions. As we do not know how our economy, agriculture, and greenhouse gas emissions will evolve in the future, scientists have developed so-called Representative Concentration Pathways (RCP). Each RCP represents one of several possible futures in economic and agricultural development, resulting in different evolutions in atmospheric greenhouse gases. The higher the concentration of atmospheric greenhouse gases, the more of the heat radiated to space by the Earth’s surface is trapped, leading to a warming of the atmosphere. RCP2.6 represents a future where we radically cut greenhouse gas emissions after a peak in 2020,  RCP4.5 a scenario, where we cut emissions after a peak in 2040, and RCP8.5 represents a scenario in which greenhouse gas levels continue to rise.
Permafrost
Permafrost – ground, which is soil or rock frozen for more than two years in a row – contains one third of global near-surface carbon stocks, and thawing of parts of the permafrost-affected area can render this carbon more available for microorganisms, thus causing emissions of stored carbon as the greenhouse gases CO2 and CH4. This additional source of greenhouse gases could cause more surface warming, thus more permafrost thaw, thus more warming and so on (Mu et al., 2017; Sun et al., 2018a).
Because ice is solid, but water drains away, permafrost thaw can cause changes in the surface (subsidence) in Northern land areas, thus damaging infrastructure and buildings. Thaw can further cause landslides or increase rockfall rates, thus risking mountain accidents and the safety of local communities (PERMOS, 2016).
The IPCC reports that permafrost temperatures have increased by 0.29°C ± 0.12°C from 2007 to 2016 on average for polar and high mountain areas. Sparse long-term data series in heterogeneous alpine environments is the largest challenge faced when quantifying temperature trends in alpine permafrost, which makes up about 28 % of global permafrost, but estimates show a 0.19°C ± 0.05 °C warming per decade in alpine permafrost on average.
Arctic long time series are sparse, but estimates show that from 2007 to 2016, the coldest permafrost areas have warmed by 0.39 °C ± 0.15 °C, whereas the ‘warmer’ permafrost close to thaw has warmed on average by 0.2 °C ± 0.10 °C – more energy has been used for melting of ice.
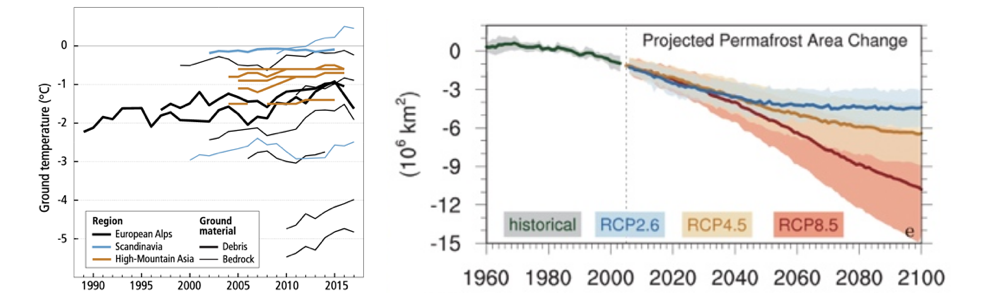
Fig. 3: Left: Trend in annual average temperatures in high-mountain regions divided into geographical regions and ground material [Credit: Figure 2.5 in the SROCC. Right: Projections for global permafrost area following emission scenarios RCP 2.6, RCP4.5 and RCP8.5 [Credit: Figure 3.10 in the SROCC].
The Special Report concludes that the frequency and intensity of wildfires has increased, removing the organic topsoil and degrading permafrost faster than historically. Read more about fire in the Arctic in this post.
The amount of projected permafrost thaw by 2100 is directly related to the RCP scenario followed by humanity (see explanatory box on RCPs). Overall, permafrost occurrence is projected to be reduced by 8 to 40% for the low-emission scenario RCP 2.6 and 49 to 89 % for the high-emission scenario RCP8.5. While the Arctic permafrost within the first three meters of the surface is projected to have decreased by 2 to 66 % in RCP2.6 and by 30 to 99 % in RCP8.5, the permafrost area of the Tibetan plateau is projected to decrease by 22 % in 2100 under RCP2.6 by 64 % in RCP8.5. In conclusion, if we follow the high-emission scenario RCP8.5, tens to hundreds of gigatons of carbon will be released to the atmosphere by 2100.
The reason for the large intervals of projections are mainly that “translating” air temperature to a ground temperature, hence permafrost presence or absence, is a difficult task due to the impact of surface properties, such as snow depth and vegetation, and ground properties, such as ground ice and carbon content, on energy propagation into and out of the soil surface. IPCC projections are based on a comparison of many models for a more robust estimate – and they simulate precipitation and vegetation patterns differently, thus impacting the simulated permafrost area.
For communities in permafrost regions, for whom 70 % of local infrastructure will be at risk of damage due to permafrost thaw by 2050, short- and long term adaptation and mitigation measures need to complement each other. Measures need to be developed with the use of scientific and local knowledge from Northern communities, and local ecosystem monitoring can be a key data source for this.
You can find full details about permafrost changes in the SROCC Section 2.2.4 and 3.4.
Snow cover
Snow cover is a critical element of the cryosphere, firstly because it absorbs surface runoff from glacier and ice sheet surfaces, and secondly because it has a high albedo, meaning that it reflects more incoming solar radiation than the darker surfaces they cover, such as ground, trees, and ice. Snow covers the terrestrial Arctic (north of 60 ºN) for up to nine months each year, and influences the surface energy budget (through its reflectivity), freshwater budget (through water storage and release), ground thermal regime (through insulation) and ecosystem interactions.
Since the beginning of the satellite era in 1981, spring snow cover extent has declined by over 13% per decade. Snow cover duration has also declined, both in spring (by up to 3.9 days per decade in certain regions) and autumn (by up to 1.4 days per decade in certain regions). Maximum snow depth has been declining, though trends are uncertain because of sparse observations and large spatial variability. These reductions are very likely driven by surface temperature rise in the Arctic. Warming-induced snow cover reduction creates a self-reinforcing cycle where the surface is darker than when it is snow covered and therefore reflects less incoming solar radiation, leading to a warmer surface and even more melting.
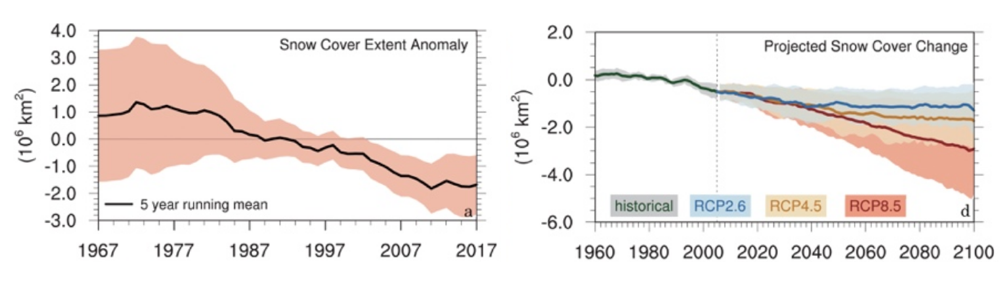
Fig. 4: Observed changes in June snow cover extent anomalies, and projected change in June snow cover under low (RCP2.6, blue), medium (RCP4.5) and high (RCP8.5) greenhouse gas emissions scenarios [Credit: Figure 3.10 in the SROCC]
Arctic snow cover duration is projected to decrease (later autumn onset in and earlier spring melting), as a result of continued Arctic-wide warming. However, trends differ between model scenarios. For example, Arctic snow cover duration stabilizes by the end of the century under RCP4.5, whereas under RCP8.5 it declines to -25% (compared to the period 1986 – 2005). In Greenland, snow cover is projected to retreat to higher, flatter areas of the ice sheet. The rate at which this could occur is currently not well reproduced in climate models, mostly due to uncertainty in the way snow processes are included in these models.
Snow cover reductions are already being felt negatively in the Arctic, especially by communities reliant on snow cover for food sources, drinking water, and livelihoods, such as reindeer herding.
You can find full details of the estimates and predictions for ice sheets in SROCC, section 3.4 and in FAQ 3.1.
Sea ice
Sea ice is frozen sea water and displaces as much water as is produced when it melts. Melting sea ice therefore does not play a role for sea-level rise. It is, however, an important element for climate as it reflects large amounts of incoming sunlight back to space (similar to snow); it provides habitat for bacteria, plants and animals below, in, and above the ice; and it influences weather in mid-latitudes, the region between roughly 30 and 60 degrees of latitude, home to over 50% of the human population.
In the context of climate change, sea ice is also an especially good element of the cryosphere to illustrate the effects of global warming. The Arctic September sea-ice area is directly linked to cumulative CO2 emissions (see this previous post) and therefore changes in sea ice directly reflect, in a very visible way, the path of climate change.
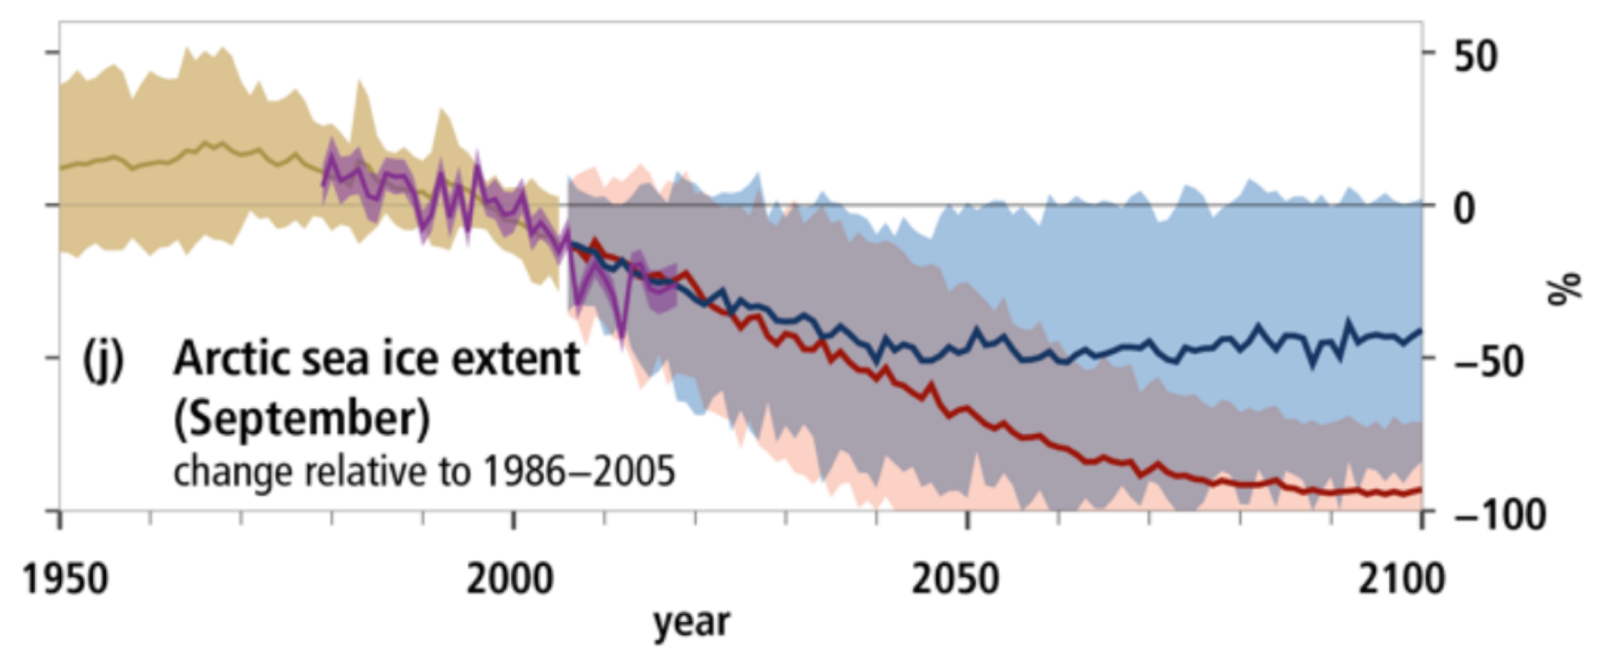
Fig. 5: Observed and modelled historical changes in the Arctic September sea ice extent since 1950 and projected future changes under low (RCP2.6, blue) and high (RCP8.5, red) greenhouse gas emissions scenarios [Credit: Figure SPM1 in the SROCC].
The sea-ice review in SROCC is similar to the Special Report on 1.5°C published end of 2018 (see this previous post). Arctic sea-ice loss was observed in both area and thickness in the past decades and is projected to continue through mid-century. The rate of the loss depends on the amount of warming. In the Antarctic, there is low confidence in the projected sea-ice evolution.
More details about the sea-ice evolution under climate change can be found in Section 3.2 of SROCC.
Polar ice sheets and glaciers
The two polar ice sheets and the world’s glaciers are a fundamental element of the world’s cryosphere. Glaciers and ice sheets cover about 10% of the Earth’s surface and contain around 70% of the world’s fresh water. They regulate the global climate system by interacting with the ocean and atmosphere and provide valuable fresh water resources to much of our planet.
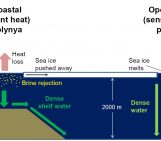
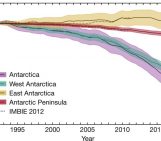
The overwhelming consensus is that the polar regions are losing ice, and that the rate of ice loss has increased. In Greenland, ice loss is occurring through a combination of enhanced surface melting and runoff, and increasing dynamic thinning (ice loss as a result of accelerated ice flow). Greenland has lost around 247 Gt of ice every year between 2012 and 2016. In Antarctica, incursion of warm ocean waters is driving rapid, accelerating ice loss from the West Antarctic Ice Sheet. The mass loss signal from the West Antarctic Ice Sheet (-122 ± 10 Gt yr -1 from 2003 – 2013) is dominated by the increasing ice loss from outlet glaciers in the Amundsen Sea Embayment. On the Antarctic Peninsula, the majority of marine-terminating outlet glaciers are retreating. The pattern of change on the East Antarctic Ice Sheet is more ambiguous and complex, with regional gains and losses and no clear overall mass trend. Increased surface melt intensity and duration on both ice sheets has led to a self-reinforcing cycle, where, like for snow, the melt of the ice sheets uncovers dark surfaces, which absorb more incoming solar radiation than ice, and therefore heat up and lead to further melt. This reduces the capacity of snow and firn to store runoff.

Fig. 6: Ice sheet from above [Credit: Matt Palmer on Unsplash].
Continued ice loss from Greenland and Antarctica is projected to alter the polar regions. While glaciers have been the dominant contributor to global sea-level rise, this will be replaced by ice sheets as they continue to lose mass into and beyond the 21st century.
However, a number of processes that could potentially lead to rapid ice loss in Antarctica are poorly understood, particularly their timescale and future rate. Therefore, large uncertainty remains in projecting future changes to these polar regions, especially beyond this century. Portions of Antarctica resting on bedrock below sea level could be vulnerable to self-sustaining feedbacks such as the Marine Ice Sheet Instability (MISI, see this previous post). It is uncertain from current observational data whether irreversible retreat is underway.
Ice shelves and their interactions with surface meltwater will play a key role in the response of Antarctica to future warming. Freshwater input to the oceans, from icebergs and ice shelves melting, is freshening global water mass currents and circulation, and this may be accelerating. This could inhibit the formation of important oceanic water masses such as the Atlantic Meridional Overturning Circulation and Antarctic Bottom Water. Surface runoff and basal melting from both ice sheets are enhancing the input of dissolved nutrients into fjords and the ocean such as iron, which has been linked to enhanced primary productivity.
The report stresses that low emissions scenarios will potentially limit the rate and magnitude of future changes to the cryosphere. For example, polar glaciers are projected to lose much less mass between 2015 and 2100 under RCP 2.6 compared with RCP 8.5. Ice loss from polar ice sheets and glaciers presents a growing challenge to polar governance, and requires more coordinated efforts to build long-term resilience. In the Arctic, mitigating the effects of climate change can benefit strongly from community-led adaptation.
You can find full details of the estimates and predictions for ice sheets in SROCC, section 3.3 and in FAQ 3.1.
In summary
As a summary of our summary, and if you are interested in the ocean topics as well, have a look at this useful infographic by John Lang!
Here, you can see the most important points for the cryosphere (click on the link below or the picture to have a larger view):
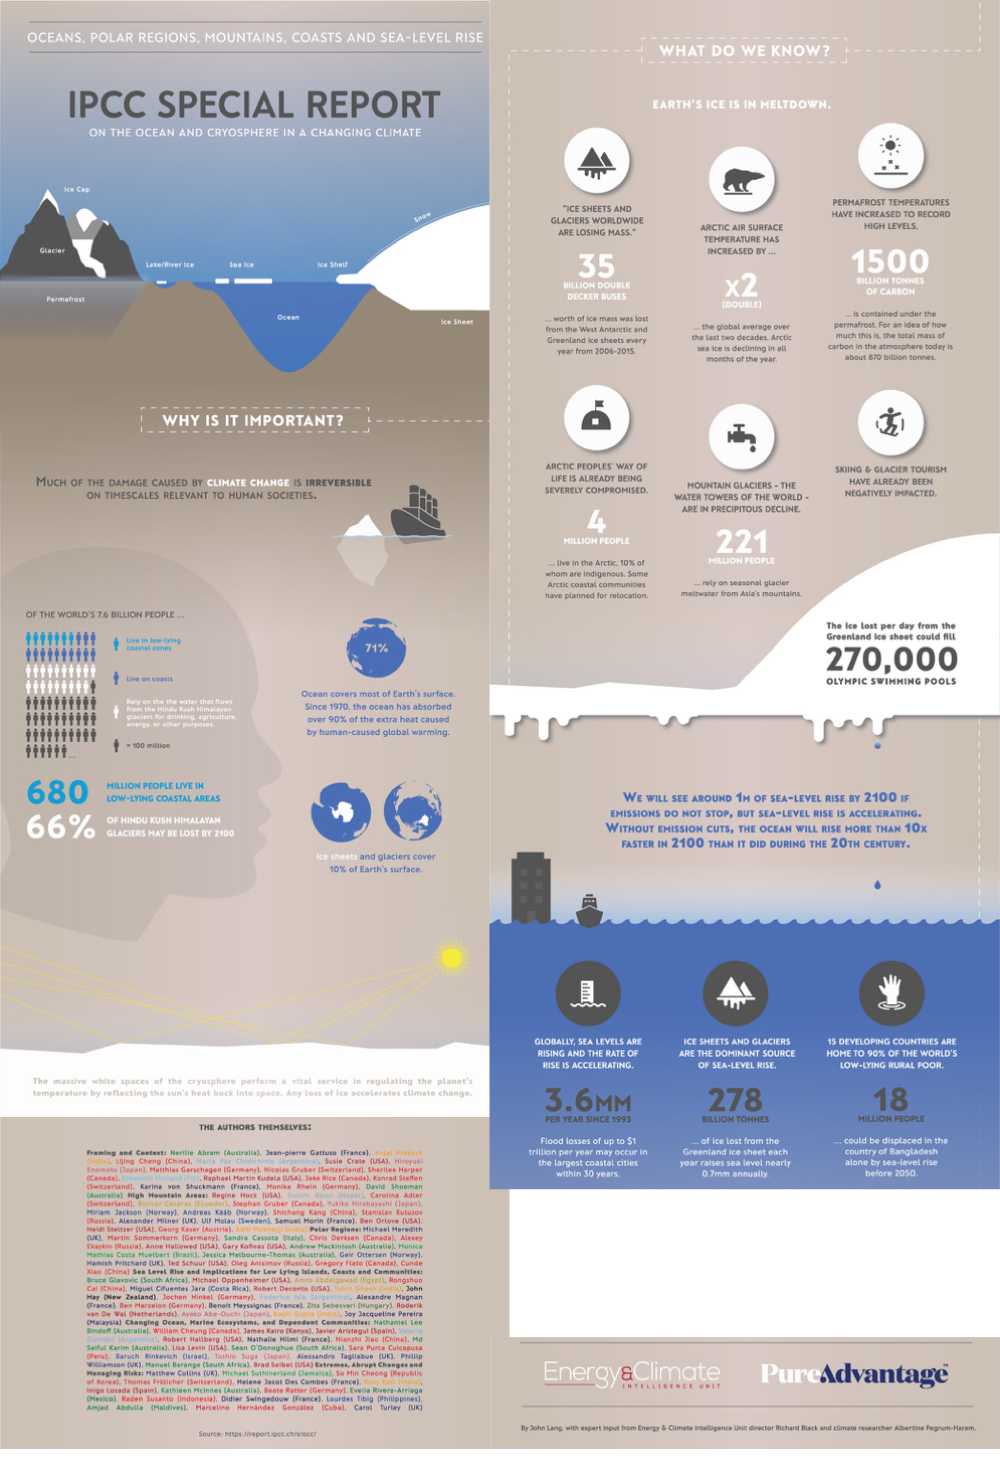
Fig. 7: Parts of a summarizing infographic about SROCC [Credit: John Lang].
Further reading
- John Lang’s complete infographic about SROCC
- In-depth Q&A about the whole SROCC report by Carbon Brief
- Official SROCC website
Edited by Emma Smith
Laura Helene Rasmussen is a Danish permafrost scientist working at the Center for Permafrost, University of Copenhagen. She has spent many seasons in Greenland, working with the Greenland Ecosystem Monitoring Programme and is interested in Arctic soils as an ecosystem component, their climate sensitivity, functioning and simply understanding what goes on below.
 Clara Burgard is a postdoctoral researcher at the Max Planck Institute for Meteorology in Hamburg. She investigates new methods to compare sea-ice as simulated by climate models, sea-ice as observed by satellites, and real sea ice. She tweets as @climate_clara.
Jenny Arthu r is a PhD student at Durham University, UK. She investigates supraglacial lakes in Antarctica using remote sensing, and is especially interested in their seasonal evolution and interaction with ice dynamics. She tweets as @AntarcticJenny.
Chris Barrell
Hi guys! You offer some great overviews of cryosphere areas but seem to gloss over the importance of Arctic Sea ice loss. In particular the short timescale for possible ice free summers and the drastic impacts, with no years marked on the chart either. Sea ice may not impact sea level rise but it’s loss will have drastic effects on ocean warming and circulation, meteorology and the biosphere to name a few…
Clara Burgard
Hi Chris,
as a sea-ice scientist, I agree with you, which is why I explained possible aspects sea ice is important for, e.g. “It is, however, an important element for climate as it reflects large amounts of incoming sunlight back to space (similar to snow); it provides habitat for bacteria, plants and animals below, in, and above the ice; and it influences weather in mid-latitudes, the region between roughly 30 and 60 degrees of latitude, home to over 50% of the human population.”
I would argue that SROCC mainly focusses on sea-level rise and global ocean changes and the review on sea ice is not very different to the one we already had in the Special Report on 1.5 degrees. This is why, we did not go too much into details here. But you are welcome to correct me on this 🙂
umer
Melting of sea ice also impact on marine life as well…..
David Docquier
Hi guys,
Great post summarizing the IPCC SROCC report.
I would just add that one of the key topics analyzed in the report is sea-level rise, which is not really detailed in this post (you mention it several times bu don’t provide the figures). I know this is not ice :), but this is clearly driven by ice melting (and ocean thermal expansion), and it has huge consequences on coastal ecosystems and human habitats.
In short, the observed global mean sea-level rise from 1902 to 2015 is 16 cm, with an accelerated rate over the past years (3.6 mm/yr for 2006-2015, compared to 1.4 mm/yr for 1901-1990). The dominant contributors are ice sheets and glaciers (1.8 mm/yr) and ocean thermal expansion (1.4 mm/yr). The accelerated rate of sea-level rise is due to the increased ice loss from Greenland and Antarctic ice sheets over the recent years.
Projections show that the sea-level rise by 2100 will be around 0.43 m (0.29-0.59 m, likely range) with RCP2.6 and 0.84 m (0.61-1.10 m) with RCP8.5, and will continue to rise beyond 2100. The rates of sea-level rise could reach 4 mm/year in RCP2.6 and 15 mm/year in RCP8.5.
The time series of global mean sea level can be found in Fig. SPM1 of the Summary for Policymakers.