With the West Antarctic Ice Sheet currently losing ice at a fast pace, leading to sea-level rise, it is very important to better understand the processes by which this ice melting occurs. In this context, Thwaites Glacier is a very good case study of an accelerating glacier, which contributes substantially to sea-level rise, and for which a huge scientific collaboration effort has recently been set up. We have already briefly mentioned this collaboration in a previous post, and this post will provide more hints about it.
Thwaites Glacier
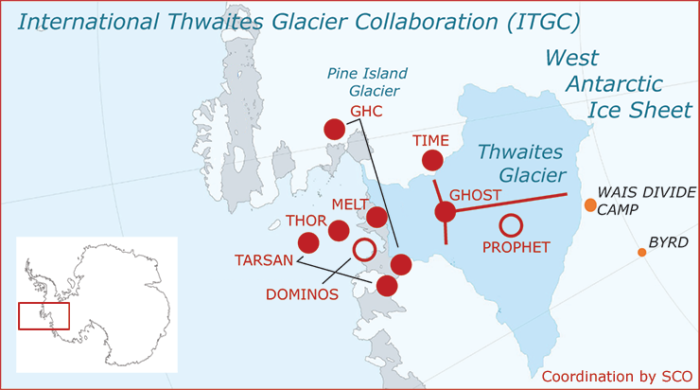
Thwaites Glacier is one of the largest glaciers in West Antarctica covering a region of the size of Great Britain (see Fig. 1).
Over the past 30 years, this glacier has undergone dramatic changes. Its ice flow has accelerated by about 50-100 m per year since 2009. Its surface elevation has thinned by about 1.5-2 m between 2011 and 2014. Its grounding line – the separation between the ice sheet that is attached to the bedrock and the floating ice shelf – has retreated by 14 km between 1996 and 2011 (more details about the importance of the grounding line in this post). And its ice mass loss has doubled between 2006 and 2014. This makes it one of the glaciers on Earth (if not the one) with the greatest potential for sea-level rise in the next years (see this review).
Thus, it is important to invest scientific effort in trying to better understand the present and future behavior of Thwaites Glacier.
The International Thwaites Glacier Collaboration (ITGC)
In this context, the largest Earth Science funding agencies in the UK and US, namely the Natural Environment Research Council (NERC) and the National Science Foundation (NSF), have teamed up to set up a 5-year collaboration program that started in 2018, the International Thwaites Glacier Collaboration (ITGC). It constitutes the largest joint project undertaken by the 2 countries in Antarctica in the last 70 years (since the conclusion of a mapping project on the Antarctic Peninsula in the late 1940s).
The ITGC program is composed of 8 different research projects and involves more than 60 scientists, divided into 6 field work projects (red solid circles in Fig. 1) and 2 modeling projects (red open circles in Fig. 1). Each ITGC project is closely linked to the overall program with the goal of advancing our understanding of the processes that control ice loss from Thwaites Glacier, and to communicate the results to the public, the wider scientific community and policymakers.
More details about all these projects can be found on the ITGC website. I also recommend that you have a look at the Thwaites Explorer, which is an interactive visualization tool providing details about how and why the glacier is changing, and how this affects global sea level.
Early findings
One example of the early findings from the ITGC program is from the PROPHET modeling project (see this study). The researchers found that the thinning of the floating ice shelf of Thwaites Glacier (and other glaciers in West Antarctica) instantaneously impacts the speed of ice flow via a loss of buttressing (see this post for an explanation of buttressing), which leads to sea-level rise.
The impact of thinning ice shelves on glacier flow had already been suggested (see this study for example), but PROPHET allowed the first quantification of this process through the combined use of an ice-sheet model and satellite observations. Fig. 2 shows the instantaneous change in ice velocity (colors) and ice mass (circles) in Antarctica from 1994 to 2012 due to ice-shelf thinning. From this figure, it is obvious that the main losses in ice mass from Antarctica occur in the Amundsen Sea, where Thwaites Glacier (TWG) is located.
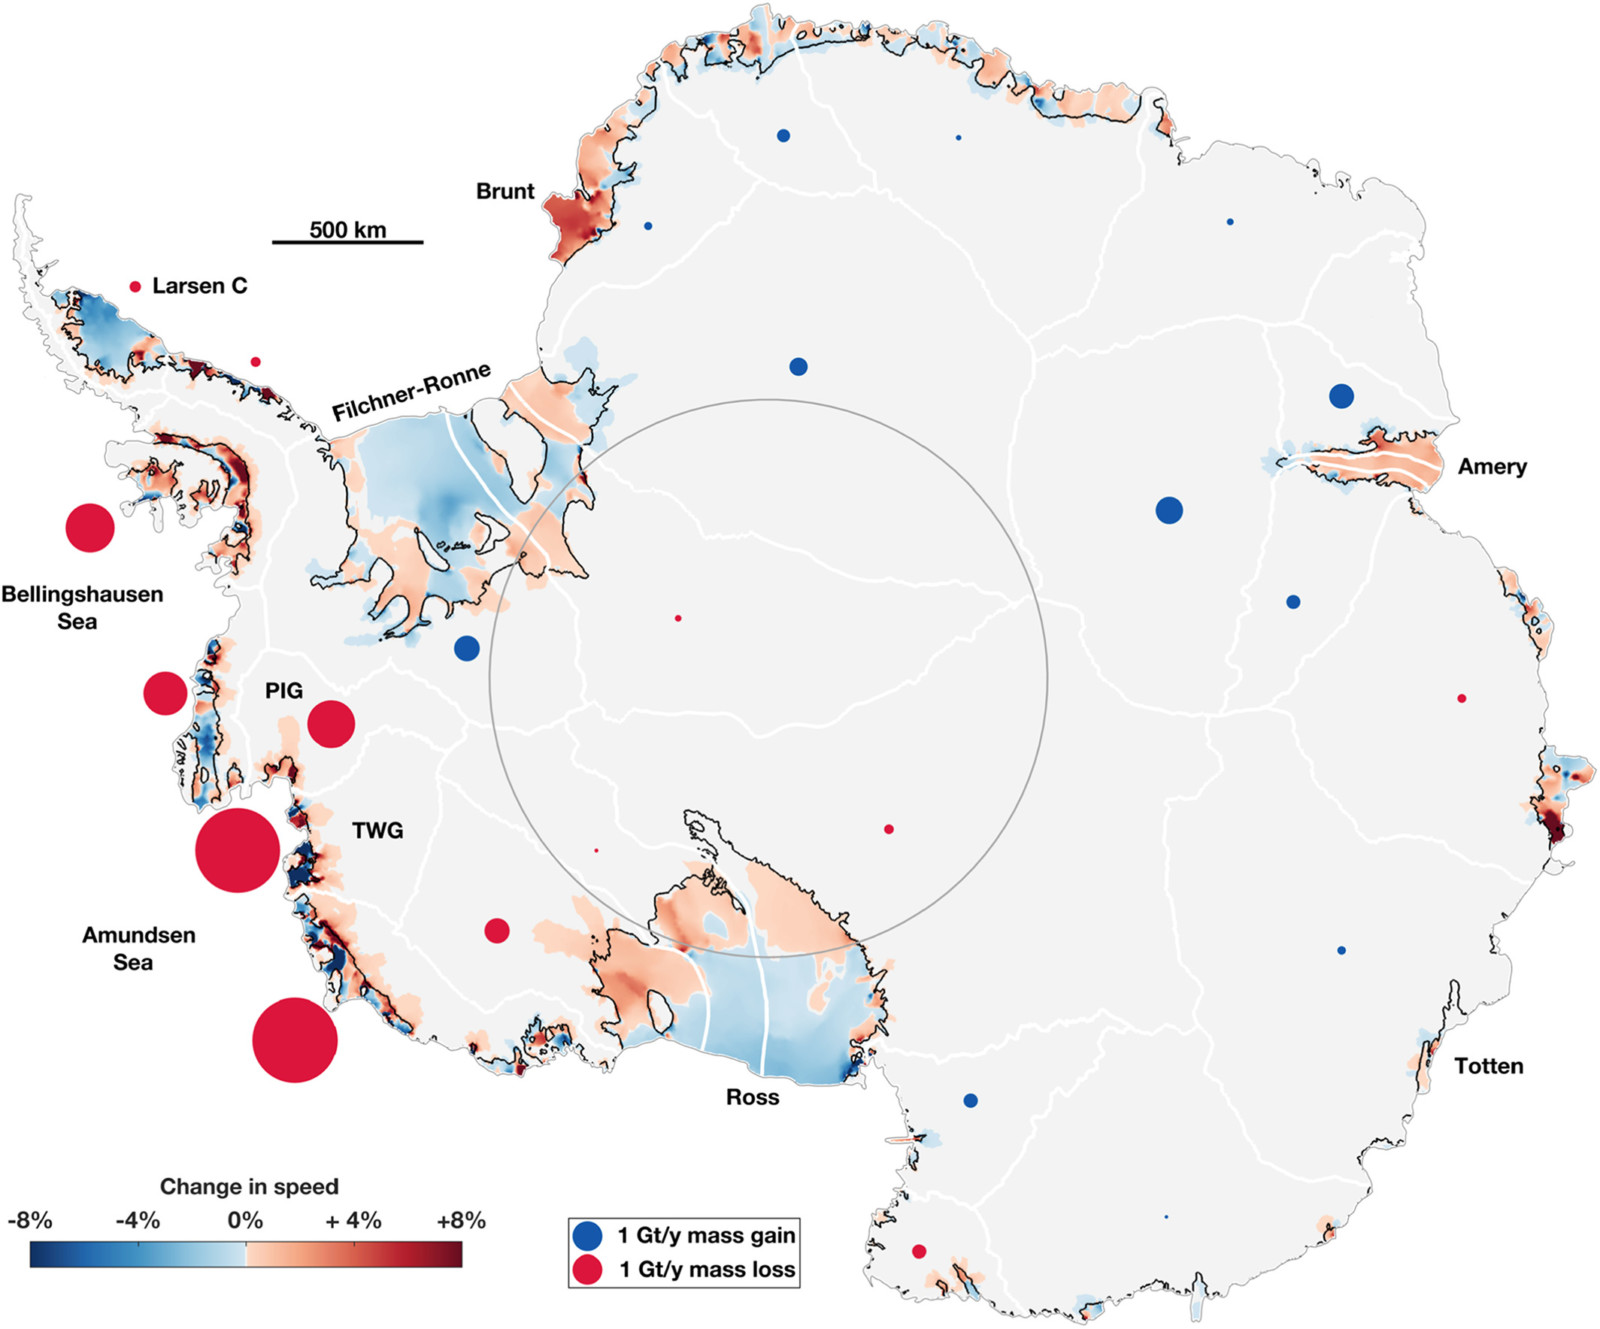
Figure 2: Map of Antarctica showing the changes in ice velocity (modeled changes in % due to observed ice-shelf thinning, in colors) and changes in ice mass (red circles mean ice loss and blue circles mean ice gain) due to ice-shelf thinning between 1994 and 2012. TWG stands for Thwaites Glacier. Credit: Fig. 2 of Gudmundsson et al. (2019).
What are we expecting from ITGC?
The example above illustrates only one of the results that have already been obtained as part of the ITGC program framework. However, many more processes are at play on the glacier and in its vicinity. Fig. 3 below shows a vertical profile of Thwaites Glacier and the ocean around it with the key drivers and their effects highlighted.
The goal of the ITGC program is to shed light on all these outlined processes, with the aim to better predict the fate of Thwaites Glacier. This will then allow scientists to refine model projections of future sea-level rise, which are of significant relevance to our society.
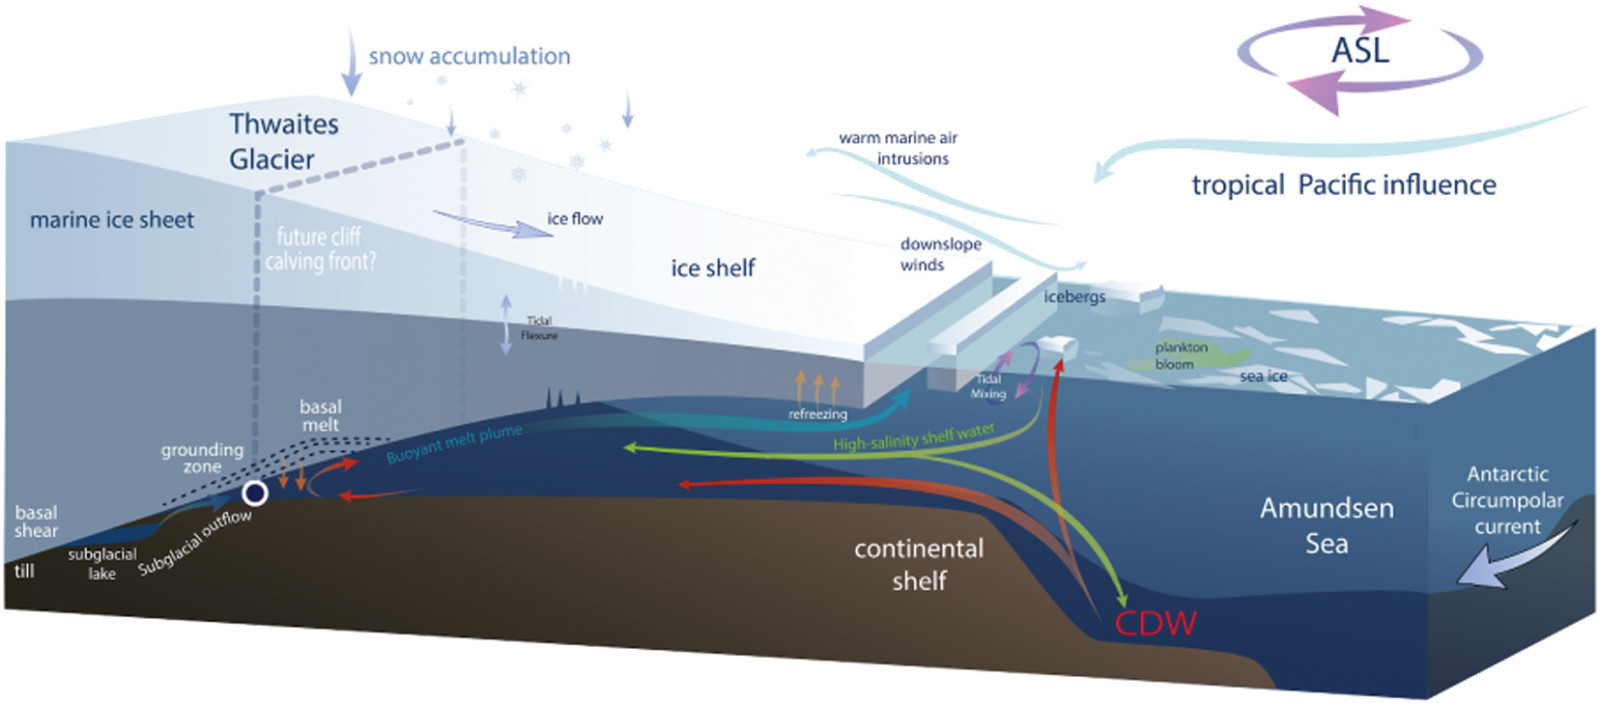
Figure 3: Vertical profile of Thwaites Glacier (white color on the left side), ocean (blue color on the right side) and bedrock (brown color on the bottom), with key drivers, processes and their effects. Credit: Fig. 2 of Scambos et al. (2017).
Further reading
- International Thwaites Glacier Collaboration (ITGC) website
- Thwaites Explorer
- Scambos et al. (2017). How much, how fast?: A science review and outlook for research on the instability of Antarctica’s Thwaites Glacier in the 21st century, Global and Planetary Change, doi:10.1016/j.gloplacha.2017.04.008
- Gudmundsson et al. ( 2019). Instantaneous Antarctic ice‐ sheet mass loss driven by thinning ice shelves. Geophysical Research Letters, doi:10.1029/2019GL085027
- BBC article from J. Rowlatt
- EGU Cryoblog ‘What’s currently going on in Antarctic science?’
- EGU Cryoblog Marine ice sheet instability “For Dummies”
Edited by Marie Cavitte
David Docquier is a post-doctoral researcher at the Swedish Meteorological and Hydrological Institute (SMHI) in Sweden. His study focuses on the interactions between ocean heat transport and Arctic sea ice using the EC-Earth global climate model. His work is funded by the EU Horizon 2020 Marie Sklodowska-Curie OSeaIce project.