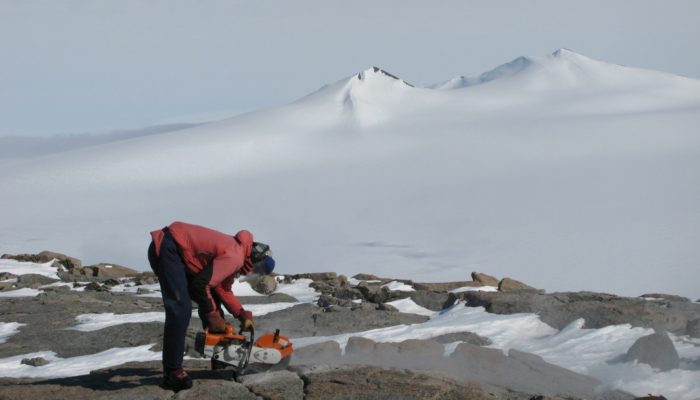
When most people hear the phrase “radiocarbon dating”, they think of measuring carbon to date organic material. But did you know that carbon is also produced within rocks, and that we can use it to learn about the past behaviour of a glacier? About 20,000 years ago it was colder and large parts of the continents were covered by ice. But what did Antarctica – the largest ice mass we have on Earth today – look like? In this blog post, we will explore what radiocarbon samples (see Fig. 1) tell us about the past of ice sheets so that we can better understand their response to climate change in the future.
Organic carbon versus carbon in rocks
Imagine a group of archaeologists find a skeleton buried beneath the Earth – they can measure the amount of time since that person died by measuring the amount of carbon isotopes left behind. Maybe you remember from your chemistry classes that isotopes are forms of the same element that have different atomic masses? For example, 14C is an isotope of “normal” carbon (12C). In contrast to normal carbon, 14C is radioactive and decays slowly over time. This is why the amount of 14C in the skeleton tells us its age. The 14C in the skeleton originates from plants which absorb it from the air. But rocks do not absorb carbon from the atmosphere like plants do – so how do carbon isotypes make their way into rocks? The carbon is made within the rocks themselves!
Let’s explore the science in a bit more detail…
The so-called “in situ 14C” is produced by cosmic rays in minerals such as quartz. Cosmic rays are high energy particles that bombard the surface of the Earth all of the time. They contain enough energy to break apart the nucleus of elements in minerals. Imagine the cosmic ray is the cue ball in a game of snooker, and the nucleus is the triangle of red balls. As the cue ball hits the triangle, it is broken apart. Similarly, the quartz, or more specifically an oxygen atom in the quartz (SiO2), is broken up by the cosmic ray into a proton, a neutron and the “in situ” 14C. It is made in place, hence the name “in situ 14C”. So, we now know how 14C is produced within rocks, but what does it tell us about the past of Antarctica?
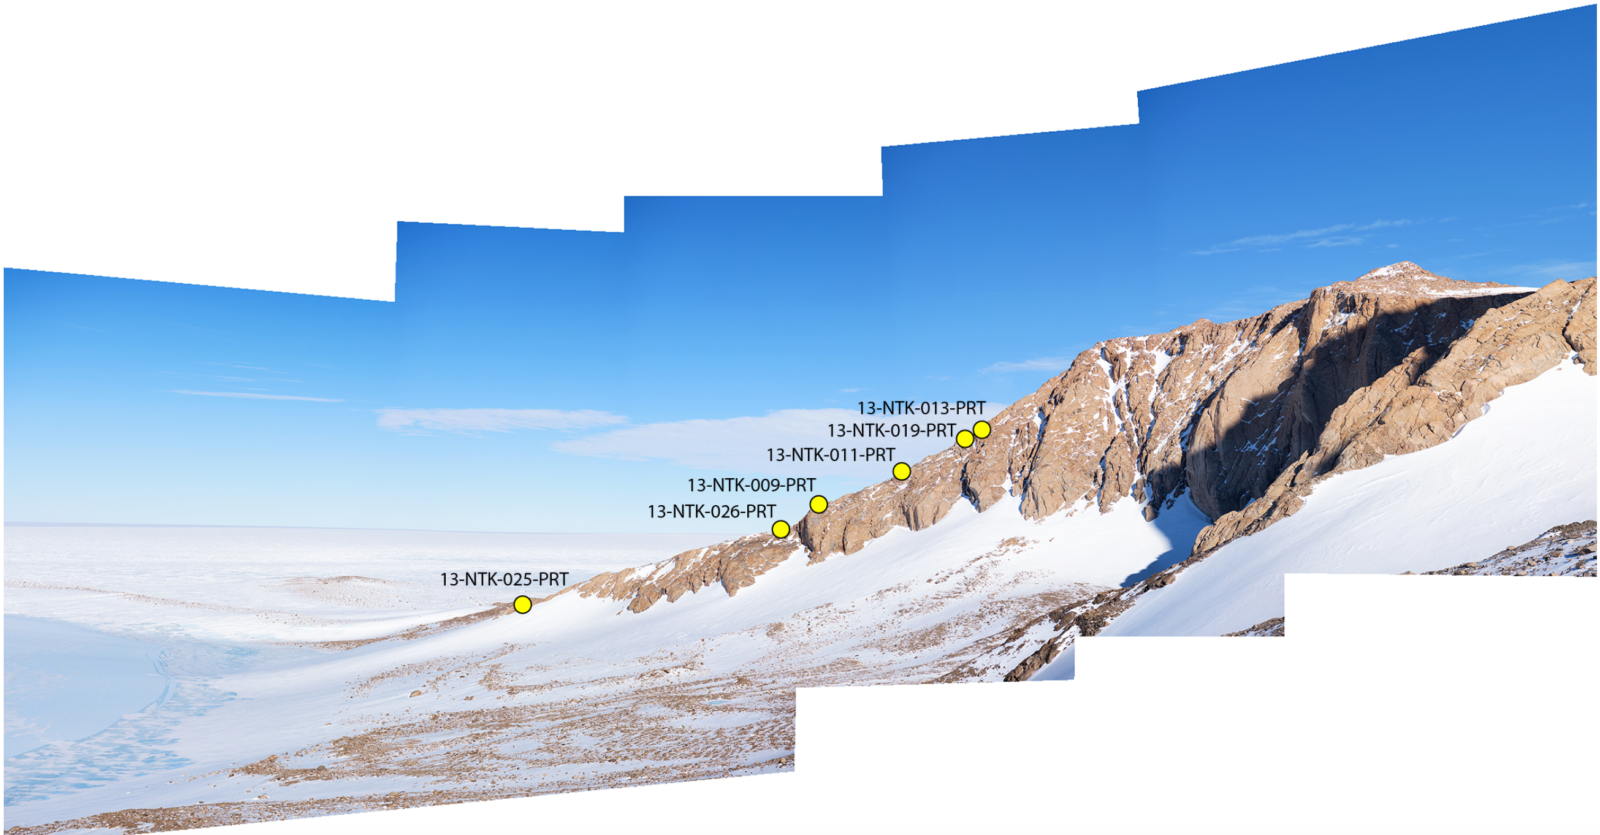
Figure 2: Sampling locations for a cosmogenic nuclide study on Mount Axtell in the Pirrit Hills, Antarctica [Credit: Figure S5 from Spector et al. (2019)].
Dating Antarctica with carbon in rocks
About 20,000 years ago, at the last glacial maximum, the Earth was colder, and sea level was about 130 m lower because the water was stored in the ice sheets. This includes the Antarctic ice sheet, which was much thicker and covered a wider area. As the climate warmed, the ice sheets melted, and sea level rose to the present level we see today (or more precisely, to the level we had before anthropogenic greenhouse gas emissions started melting the ice worldwide, see here or here). As the Antarctic ice sheet thinned, mountains that were covered by ice were slowly uncovered, like the one shown in Figure 2. Whilst the mountain was covered, no radiocarbon was produced in the rock because cosmic rays cannot travel through ice. Previously generated, old radiocarbon decayed away, so that the rock was “clean” from radiocarbon. But as the mountain is revealed by the thinning ice sheet, new radiocarbon is made in the rocks. The longer the rocks are exposed, the more 14C builds up.
This means that we can work out the “exposure age” of the rock from the amount of in situ 14C that we measure. Note that this is different to how organic radiocarbon dating works, which measures how much carbon has decayed away to work out an age. If we look at Figure 2 again, the samples at the top of the mountain will have the oldest ages, as they were uncovered first, whilst the samples closest to the modern ice surface were uncovered last.
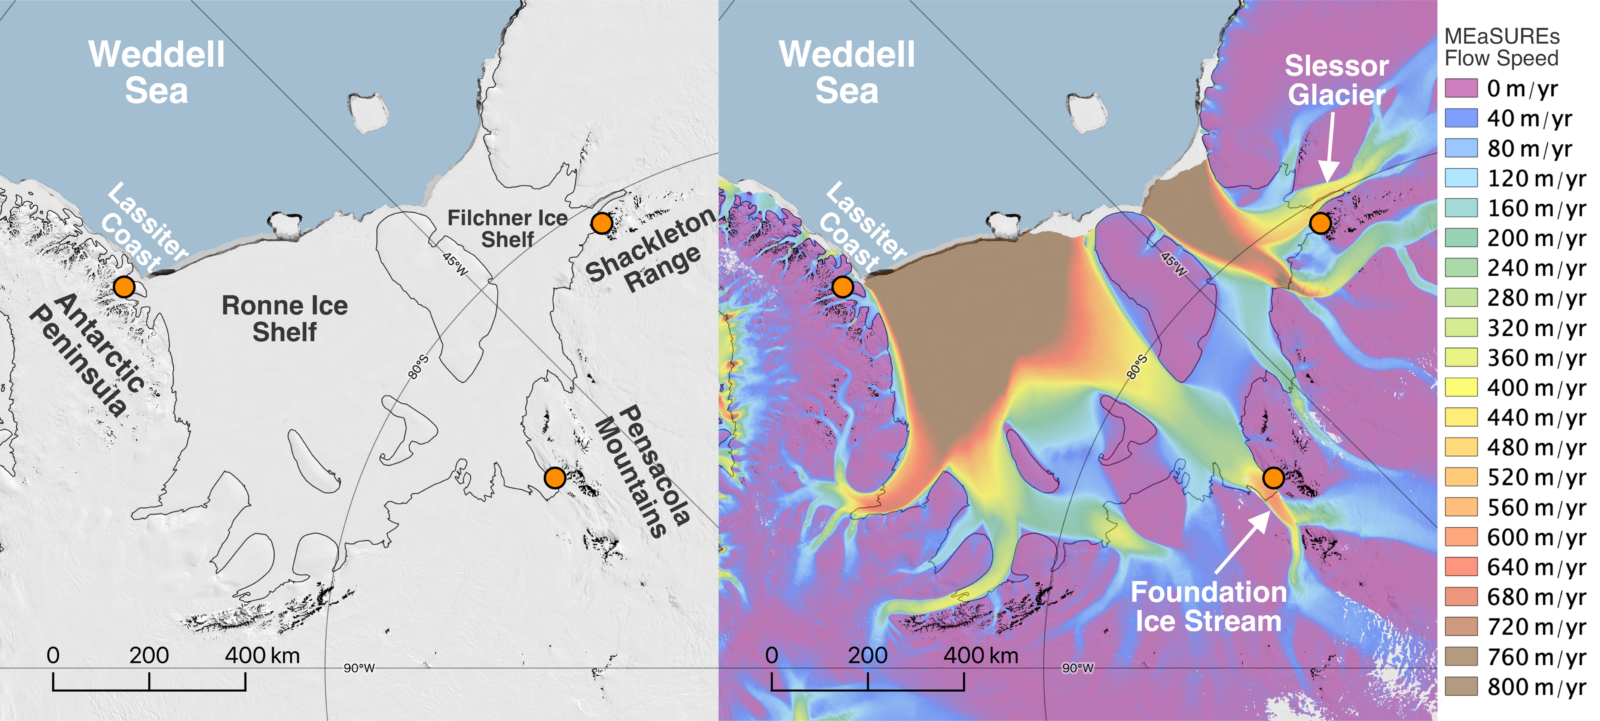
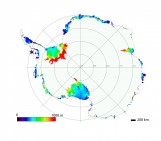
Figure 3: The Weddell Sea Embayment, Antarctica. Left: Orange circles show locations where samples of rock were collected. Satellite imagery from the Landsat Image Mosaic of Antarctica (LIMA, USGS). Right: Colour shows the speed of ice to highlight the different ice streams (Rignot et al., 2017). Maps made using Quantarctica (Matsuoka et al., 2018).
Stories from rocks for the Weddell Sea Embayment, Antarctica
For my PhD project, my collaborators and I worked with samples from the Weddell Sea Embayment, Antarctica (Figure 3). You may have heard of the Weddell Sea before, as it is where Ernest Shackleton’s ship, the Endurance, became trapped in ice about a hundred years ago.
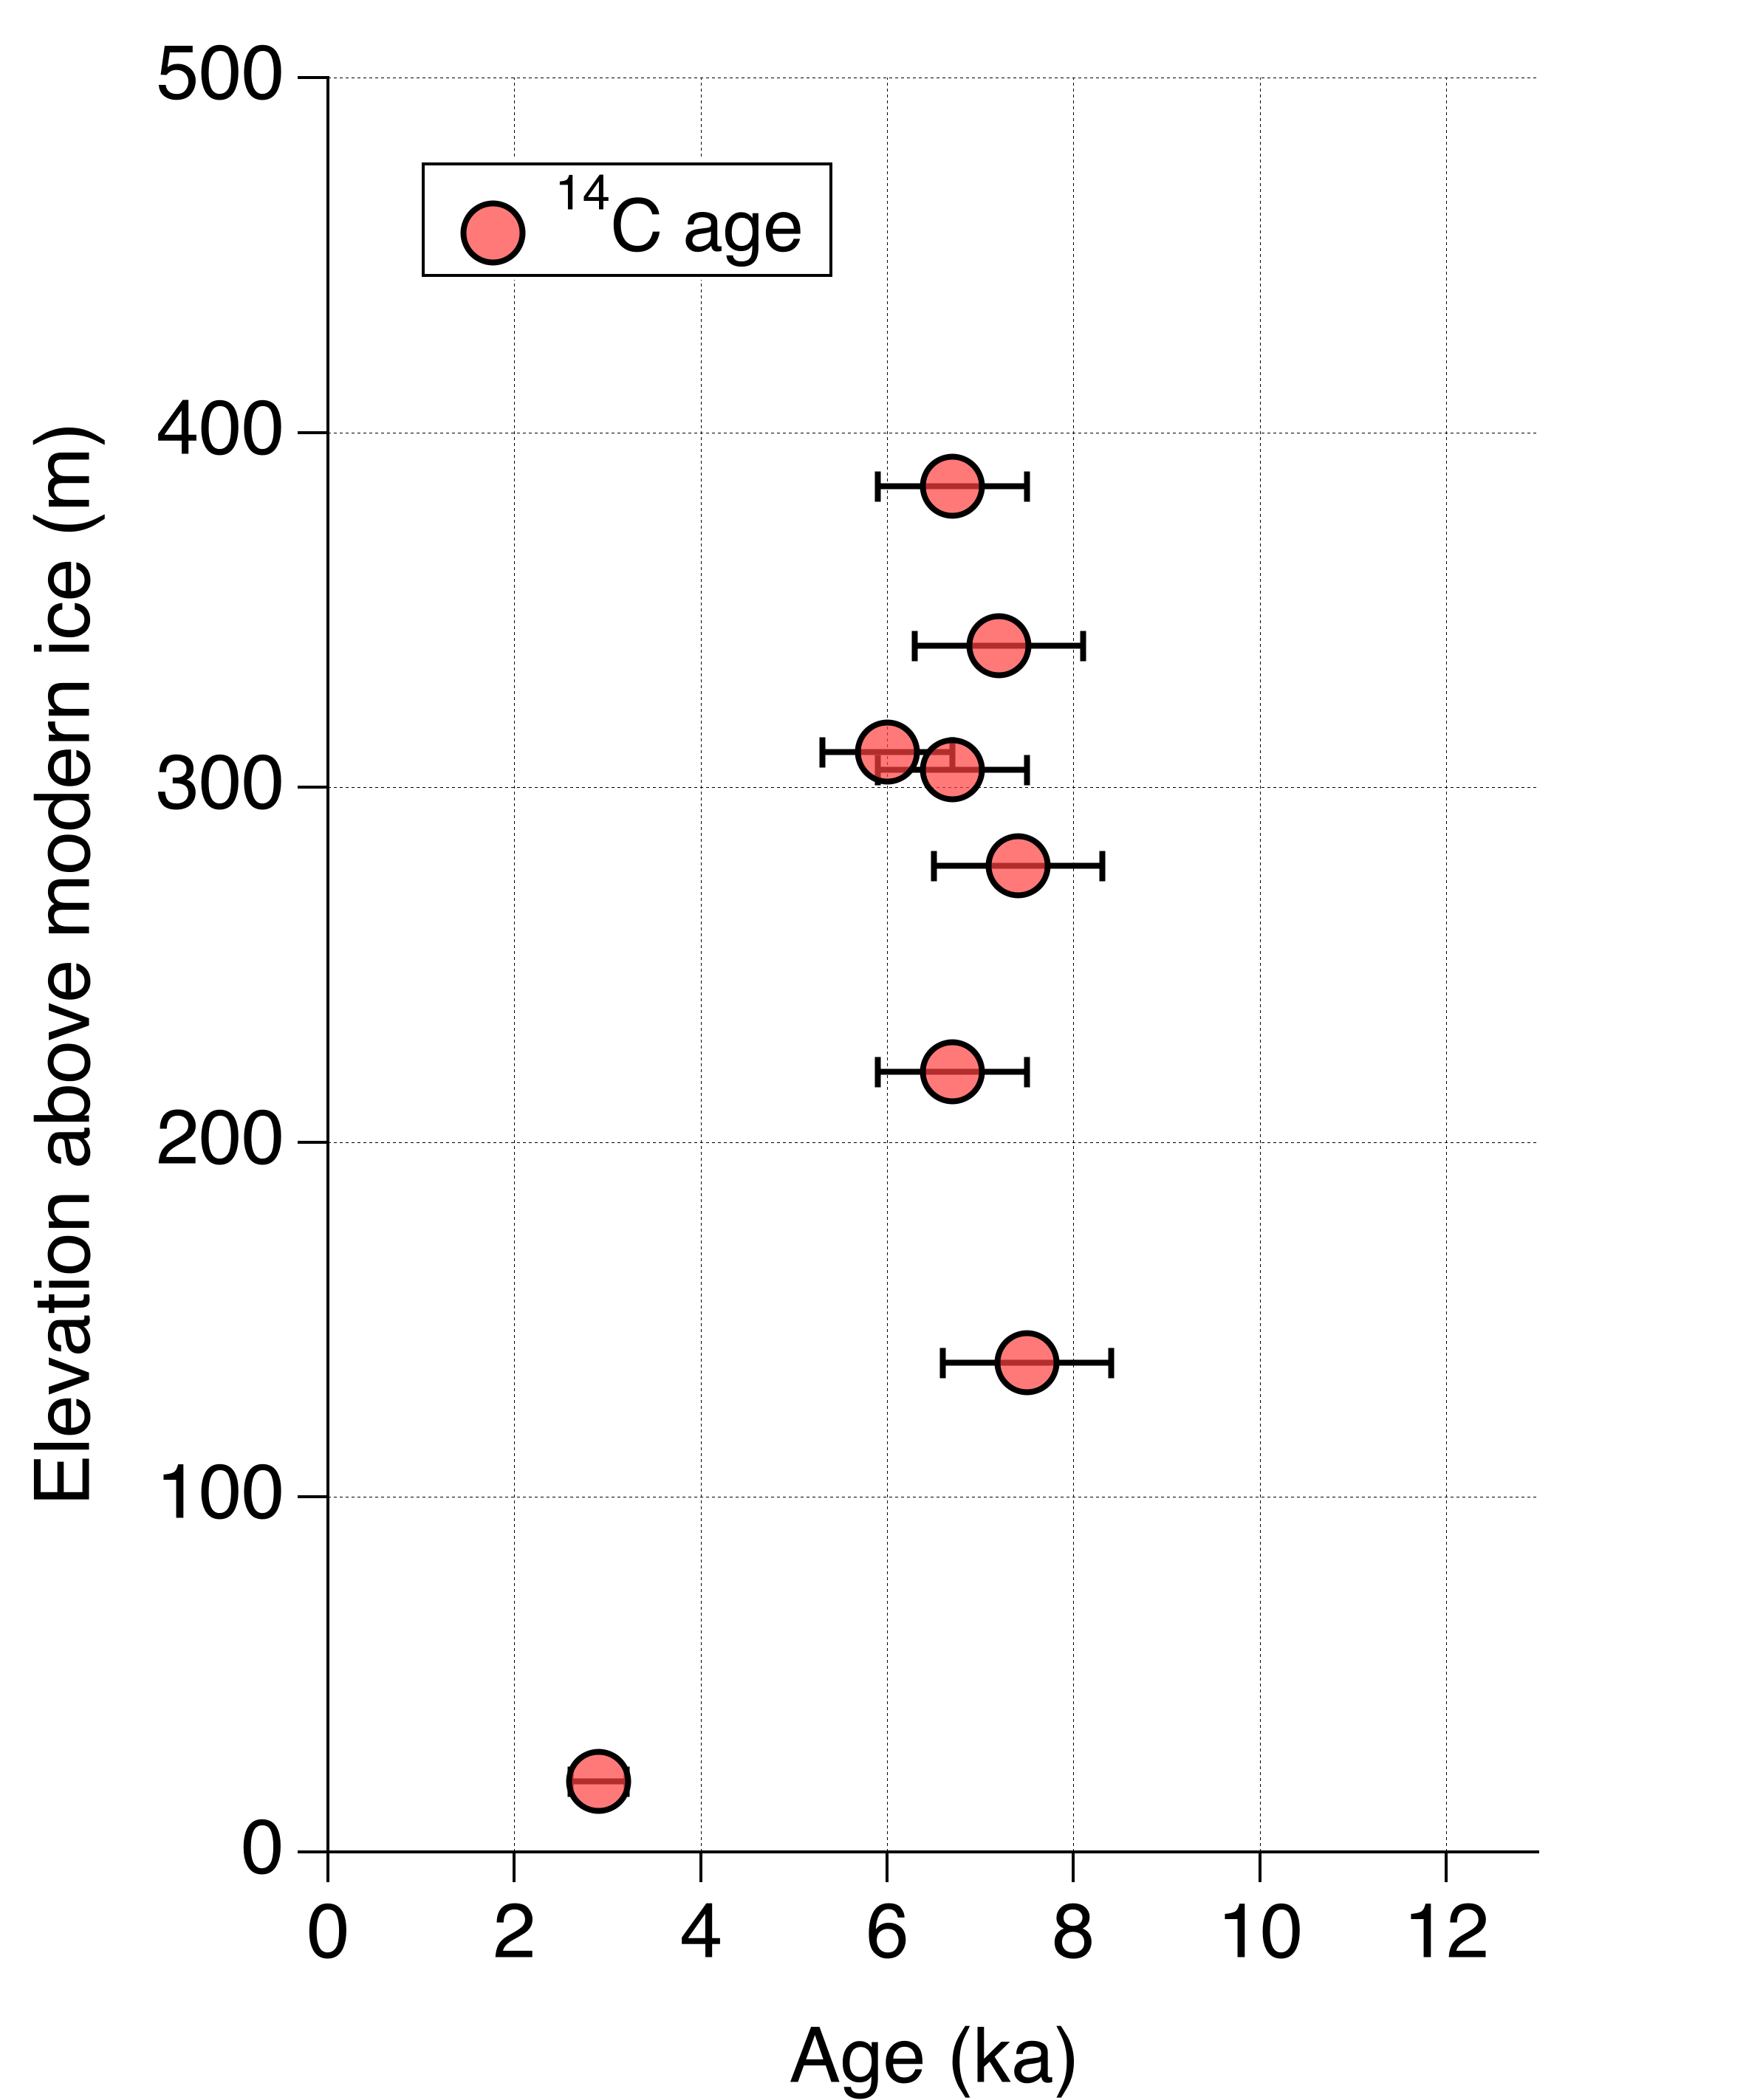
Figure 4: In situ 14C exposure ages from the Lassiter Coast, Antarctica [Credit: Based on data published in Nichols et al. (2019) and Johnson et al. (2019)].
We wanted to work out how much thicker this part of the Antarctic ice sheet used to be, and how much it added to sea level as it melted. To this aim, we measured in situ 14C from rocks collected next to the Foundation Ice Stream and Slessor Glacier (Figure 3, if you want to learn more about ice streams, check out these two blog posts). We also measured in situ 14C in rocks collected from the Lassiter Coast on the Antarctic Peninsula.
Figure 4 shows that the exposure ages for the samples from the Lassiter Coast are mostly around 7000 years, and that they were collected from up to 385 m above the modern ice sheet. This means that 7 thousand years ago the ice sheet was more than 385 m thicker on the Lassiter Coast than it is now, a change that is larger than the height of the Eiffel Tower in Paris or The Shard in London (Fig. 5)! We also found that the Foundation Ice Stream was at least 800 m thicker than it is at present, a change in thickness that is almost as tall as the tallest building in the world, the Burj Khalifa in Dubai!
Based on these samples, we did some rough calculations that showed that, of the 130 m of global sea level rise since 20,000 years ago, the Weddell Sea Embayment may have contributed between 1.5 and 4.6 m. Our new measurements on the past thickness of ice can now be used to test the performance of complex, numerical models. Based on an understanding of the past, the models then help to inform us about the response of the ice sheet to future climate change.
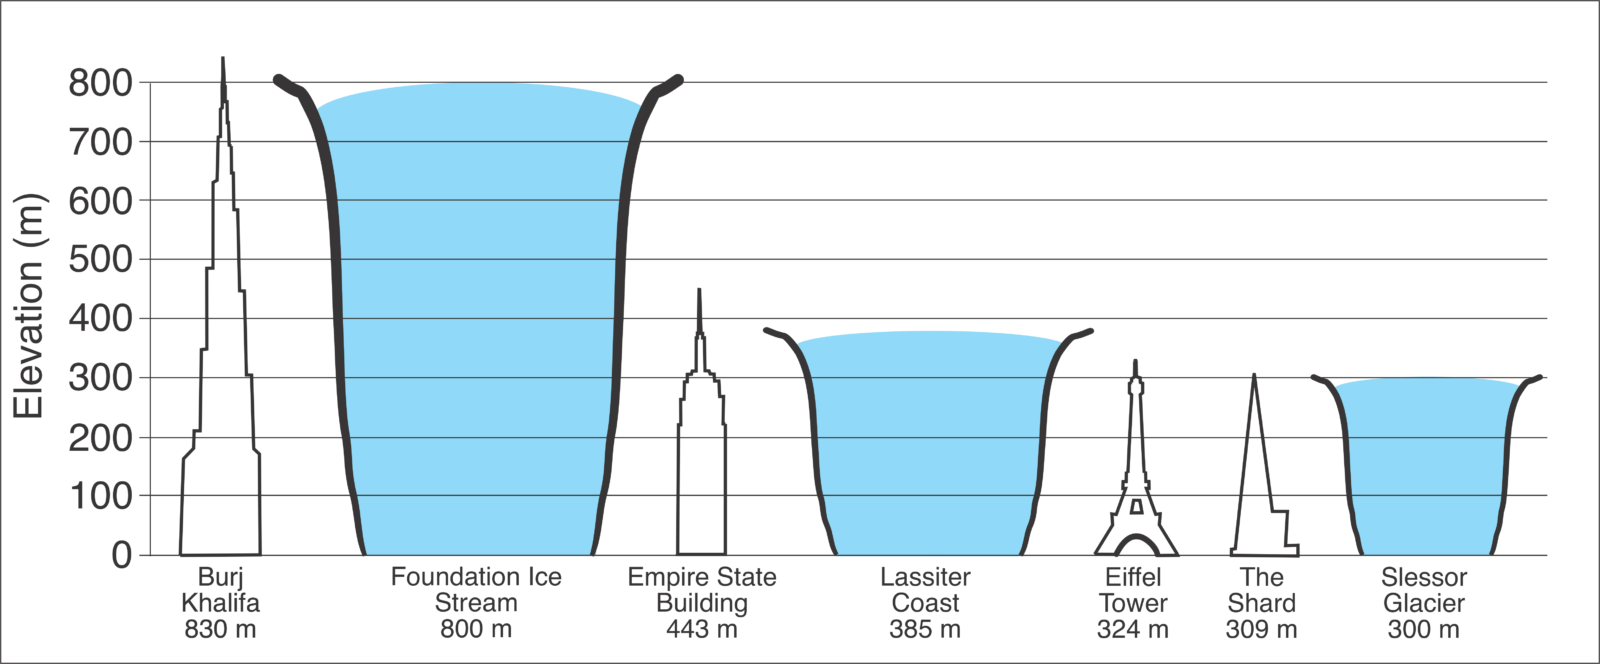
Figure 5: Schematic showing how much thicker than present the Foundation Ice Stream, Slessor Glacier, and ice at the Lassiter Coast was about 20,000 years ago (in metres above modern ice) compared to famous buildings. Thickness constraints from Nichols et al. (2019) and Johnson et al. (2019). Glaciers are highly simplified, width not to scale [Credit: Keir Nichols].
Further reading
- Antarcticglaciers.org – Cosmic Rays, and Cosmogenic Nuclide Exposure Dating
- Goehring, B. M., Wilson, J., and Nichols, K. (2019): A fully automated system for the extraction of in situ cosmogenic carbon-14 in the Tulane University cosmogenic nuclide laboratory, Nuclear Instruments and Methods in Physics Research Section B: Beam Interactions with Materials and Atoms, 455, 284-292, doi: 10.1016/j.nimb.2019.02.006
- Hillenbrand, C. D., Bentley, M. J., Stolldorf, T. D., Hein, A. S., Kuhn, G., Graham, A. G. C., Fogwill, C. J., Kristoffersen, Y., Smith, J. A., Anderson, J. B., Larter, R. D., Melles, M., Hodgson, D. A., Mulvaney, R., and Sugden, D. E. (2014): Reconstruction of changes in the Weddell Sea sector of the Antarctic Ice Sheet since the Last Glacial Maximum, Quaternary Science Reviews, 100, 111–136, doi: 10.1016/j.quascirev.2013.07.020.
- Johnson, J. S., Nichols, K. A., Goehring, B. M., Balco, G., and Schaefer, J. M. (2019): Abrupt mid-Holocene ice loss in the western Weddell Sea Embayment of Antarctica, Earth and Planetary Science Letters, 518, 127–135, doi: 10.1016/j.epsl.2019.05.002.
- Nichols, K. A., Goehring, B. M., Balco, G., Johnson, J. S., Hein, A. S., and Todd, C. (2019): New Last Glacial Maximum ice thickness constraints for the Weddell Sea Embayment, Antarctica, The Cryosphere, 13, 2935–2951, doi: 10.5194/tc-13-2935-2019.
Edited by Ronja Reese
 Keir Nichols is a PhD Candidate at Tulane University, New Orleans, USA. He investigates the history of ice sheets using measurements of cosmogenic nuclides, primarily in situ 14C. Cosmogenic nuclides provide vital constraints for researchers modelling the past behaviour of ice sheets to help us understand how they might respond to climate change in the future. He tweets as @CosmoKeir. Contact Email: knichol3@tulane.edu
![Image of the Week – Seven weeks in Antarctica [and how to study its surface mass balance]](https://blogs.egu.eu/divisions/cr/files/2019/02/Vue_globale-161x141.jpg)