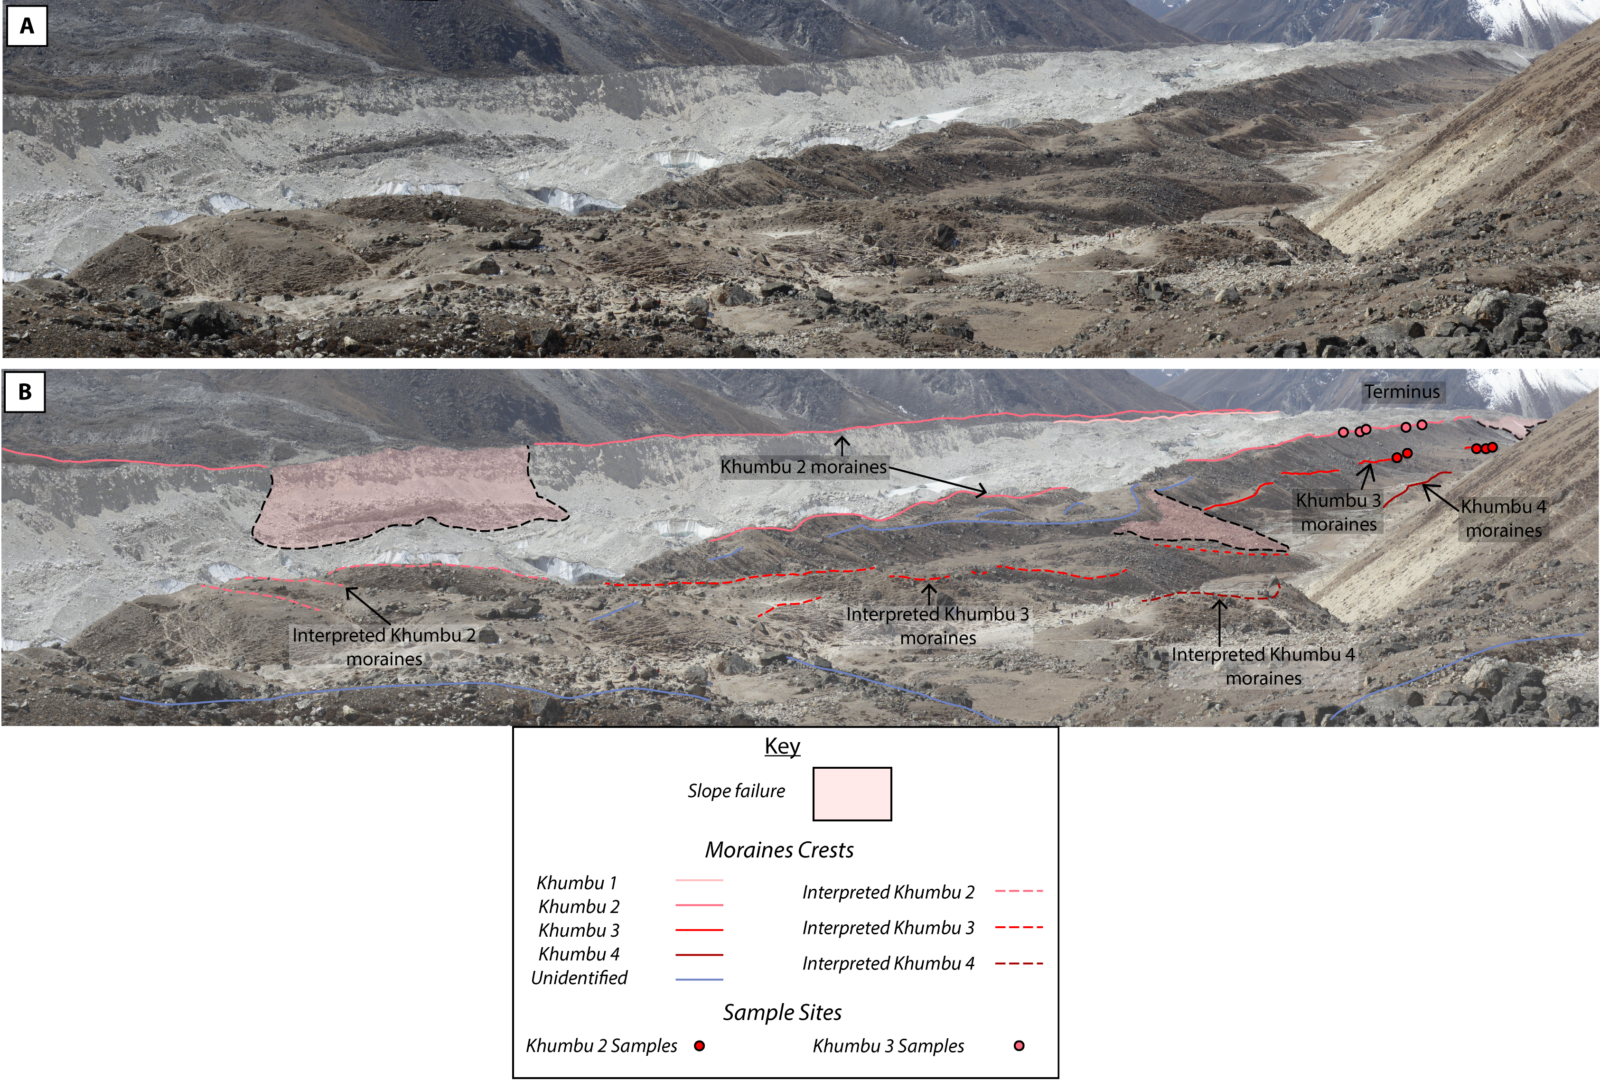
Figure 1 – The lateral moraines of the Khumbu Glacier, Nepal (A+B). Taken from the true right of the glacier and the confluence with Changri Nup/Shar. A shows the original photo; B shows the annotation highlighting different moraines. Numbers assigned based on distance from glacier tongue. Dots represent where rock samples were collected from moraine crests. Yellow circle highlights walkers for scale. [Credit: Martin Kirkbride (photo), mapping and sample collection completed by Jo Hornsey]
We’re only just really starting to comprehend the state and fate of Himalayan glaciers due to a scarcity of research along the monumental mountain range. Climbers and scientists have been observing these lofty glaciers since the 1900s. However, is that looking back far enough? Glacier moraines, featuring in this Image of the Week, can reveal change extending back thousands of years.
You may look at Figure 1 and think ‘what is that?! It’s a mess!’ and you would be right to do so. The only glacier ice visible is where ice cliffs break the debris-covered surface of Khumbu Glacier (Figure 2), which begins in the Western Cwm. If you let your eyes adjust to the medley of rocks and many shades of brown, you can start to pick out lines and shapes. Some are highlighted by the sunlight whilst others take a more discerning eye. If your eyesight is very good, you can spot the people on a path in the lower right area (highlighted by the yellow circle), which give a sense of scale to this landscape. These huge mounds of rock and debris (called moraines), though appearing messy and interwoven, are vital pieces of evidence which show how much the glacier is shrinking; extending thousands of years back beyond the satellite record or human observations.
But why the mess?
The young Himalayan fold mountains produce huge amounts of debris due to the extreme weather and ongoing orogeny. The summer monsoon also provides significant amounts of intense precipitation, which erodes slopes and sediment, causing a highly mobile landscape, and a continual cacophonous supply of rocks and sediment to the Khumbu Glacier (Figure 2); creating a surface blanket known as debris cover. This debris alters how the glacier would normally melt and results in the surface of the glacier lowering through time, rather than the terminus retreating as so often seen on ‘clean’ ice glaciers. Though data collection is improving constantly, access to the Khumbu (nearly a week’s trek with several days of altitude acclimatisation) limits the range of monitoring techniques available and reduced oxygen controls your ability to collect data. Whilst there is observational data, such as satellite imagery and observations from explorers/scientists during the 1900s, it is limited in temporal and spatial resolution. This is where my research on glacier moraines comes in.
A longer time frame
I have spent the last year and ¾ (I am a PhD student; I am counting every second!) mapping the landforms which these great bodies of ice leave behind. This mainly consists of mapping lateral moraines (Figures 1 and2) as these represent the height of the glacier surface at the time it built the moraines and can be used to reconstruct a patterns of glacier evolution. These landforms have differing patterns (size, shape, preservation etc) between glacial valleys, sometimes even within the same valley, telling us that there are local and regional differences in glacier behaviour. To uncover when this all happened, I did what every person thinks I do when I tell them my PhD is based in geography; I went to collect rock samples from the glacier moraines (Figures 1 and 3).
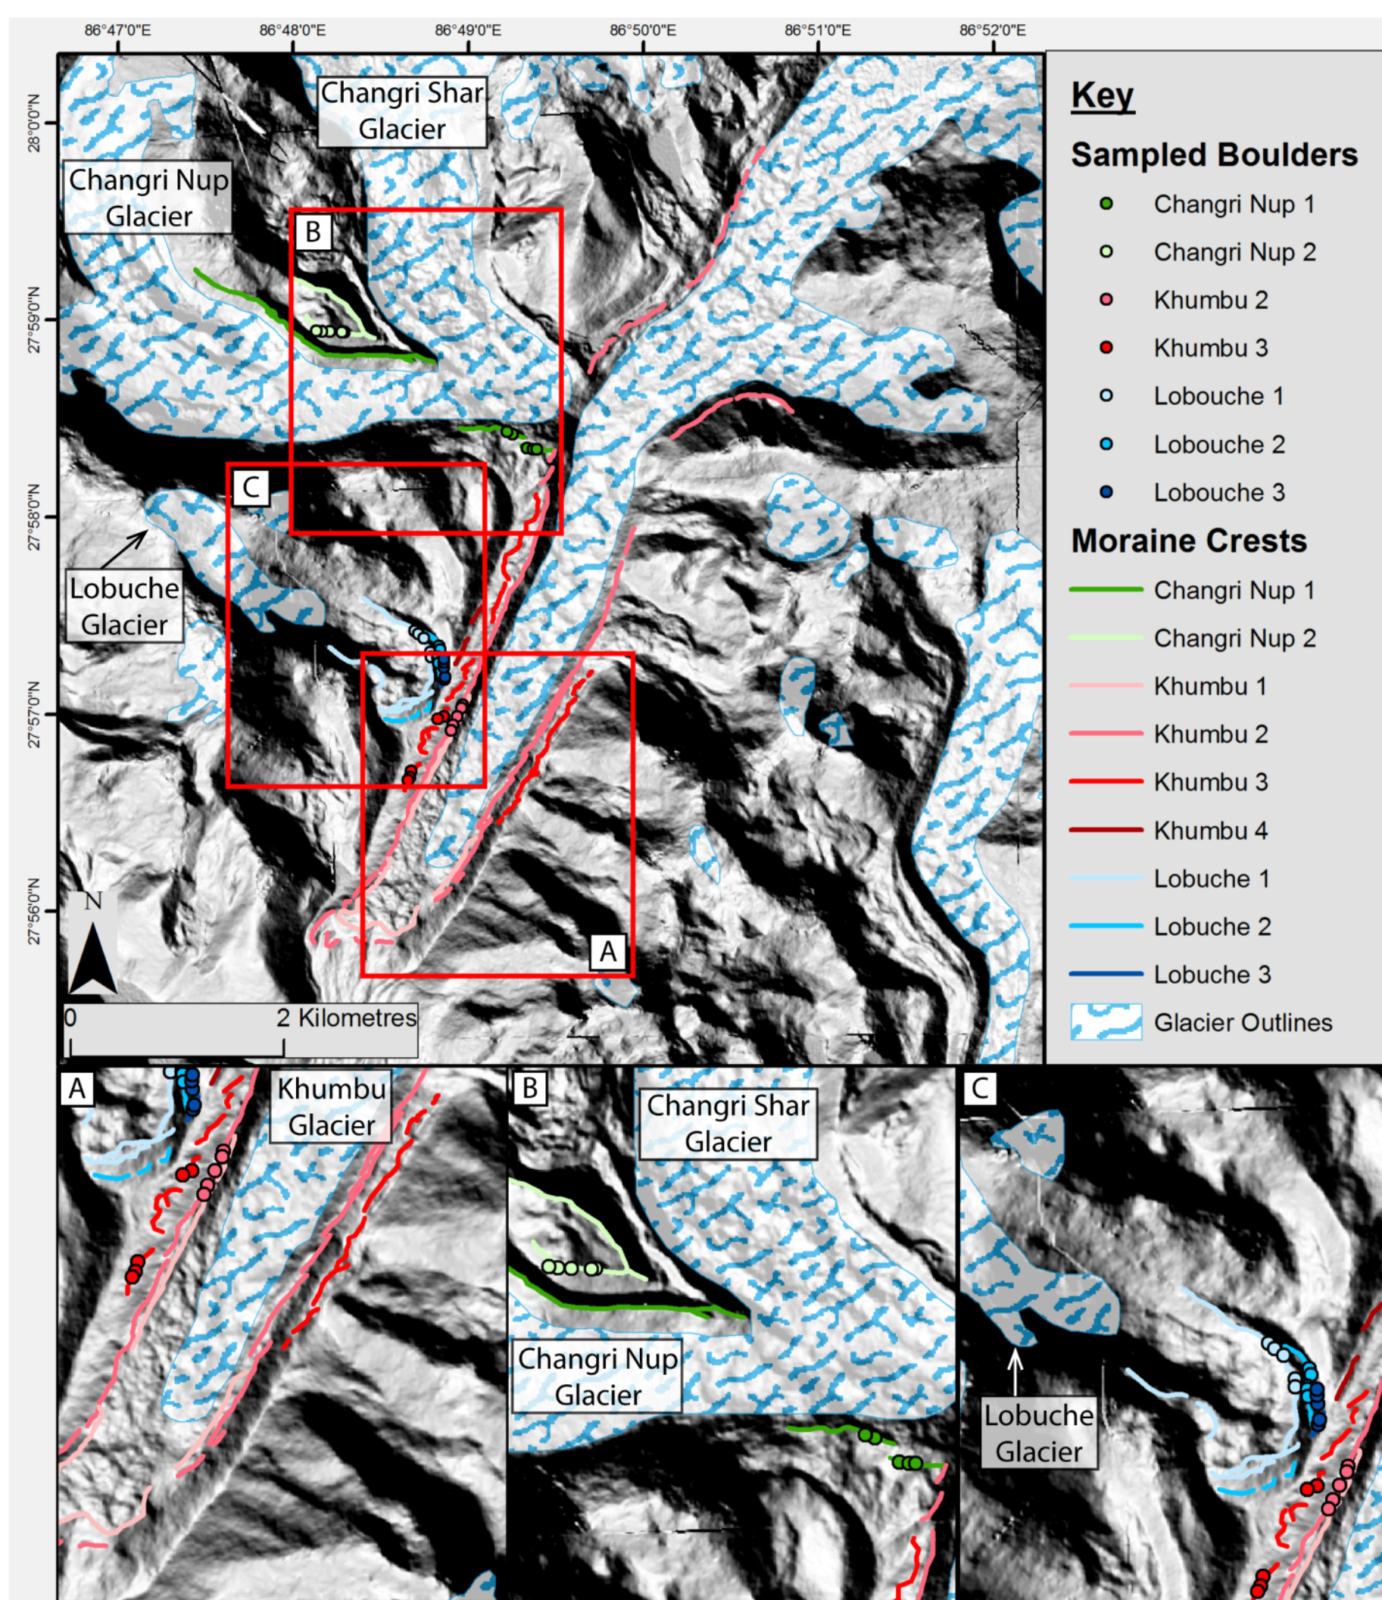
Figure 2 – Mapped moraines. The moraines are identified by the different coloured lines (higher numbers represent older moraines). The dots represent the areas where rocks were sampled for dating. The contemporary glacier outlines were taken from the Randolf Glacier Inventory GLIMS data set. The Digital Elevation Model was taken from the High Mountain Asia 8m resolution data set (Shean, 2017). [Credit: Mapping of moraines and sample collection completed by Jo Hornsey].
Rocks can tell the time?
Well, no; they can’t. But using a technique known as Exposure Dating, we can assign an age to a rock surface if we’re sure that surface has been in that position on that landform since it was put there by the glacier. This means, if we choose rocks on the crests of the moraines (similar to the one I am stood on in Figure 3), we can interpret the age we get from that rock as the time that the glacier surface was there building that landform. If we do it for the mapped moraines of the Khumbu Glacier (Figure 2), then we can start to build a timeline of glacier recession. Thanks to studies in the 1980’s and to a couple done in the early 2000’s (e.g. Richards, et al., 2000; Finkel, et al., 2003), we’re pretty confident that the most glacier proximal landforms were built around 500 years ago during a hemispheric wide cooling event. This event was significant enough to build the towering lateral moraines which are significantly larger than those mounds you can see bordering them in Figure 1. Importantly, this event occurred before the western industrial revolution. Therefore, by looking at moraine building events before this, we can recreate how glaciers were before humanity’s dependence on fossil fuels developed, i.e. a time where glaciers were able to reach a point of stability and build landforms. By including smaller, distal moraines as well as the mammoth slopes of those most proximal to the glacier, we can construct a chronology of the Khumbu Glacier’s behaviour over the Late Holocene (2500 years ago to present in the Himalaya), into the last point of stability, and onto the behaviour we see today.
So, then what?
I’m glad you asked. Once we have a chronology for the glacier’s behaviour, we can start to compare it to the modern-day behaviour. This can be done using direct comparisons between glacier extent and thickness or using glacier models. Models can be useful as they are able to recreate the behaviour between the moraine building phases. I will be applying my chronology to a dynamic glacier model known as iSOSIA, one that was adapted to be able to simulate the development of debris covered glaciers. The chronology will act as parameters within the model (so that it knows the moraines must be built by a certain time), and the model can then recreate the glaciers behaviour whilst it was building these striking landmarks. We can use the model to improve our understanding of how these glaciers have become debris covered, what they would be like if they weren’t, and what might happen to them as climate change continues.
What is this all for?
Having travelled to the Khumbu valley and spent days staggering around on the debris-covered glacier trying in vain to catch my breath, the sense of our impact on the world hit home quite dramatically. Whilst the Khumbu valley is a particularly busy valley, you’re still days away from any form of infrastructure. The moment you travel off the well-worn path, it’s the most incredibly peaceful landscape. Not because it’s silent; the glacier is constantly making noise as it slowly flows down the valley and debris shifts around the surface. It is because it is entirely natural. When there are no helicopters to be heard, in that moment, you could be the only person alive. In the face of an ever-expanding world, I believe it is important to protect and preserve these natural spaces, and those dependent on them.
Humans will not last forever, or even for a long time in the grand scheme of things, but if we’re not careful, our impact might. I don’t think future populations of any species deserve that.
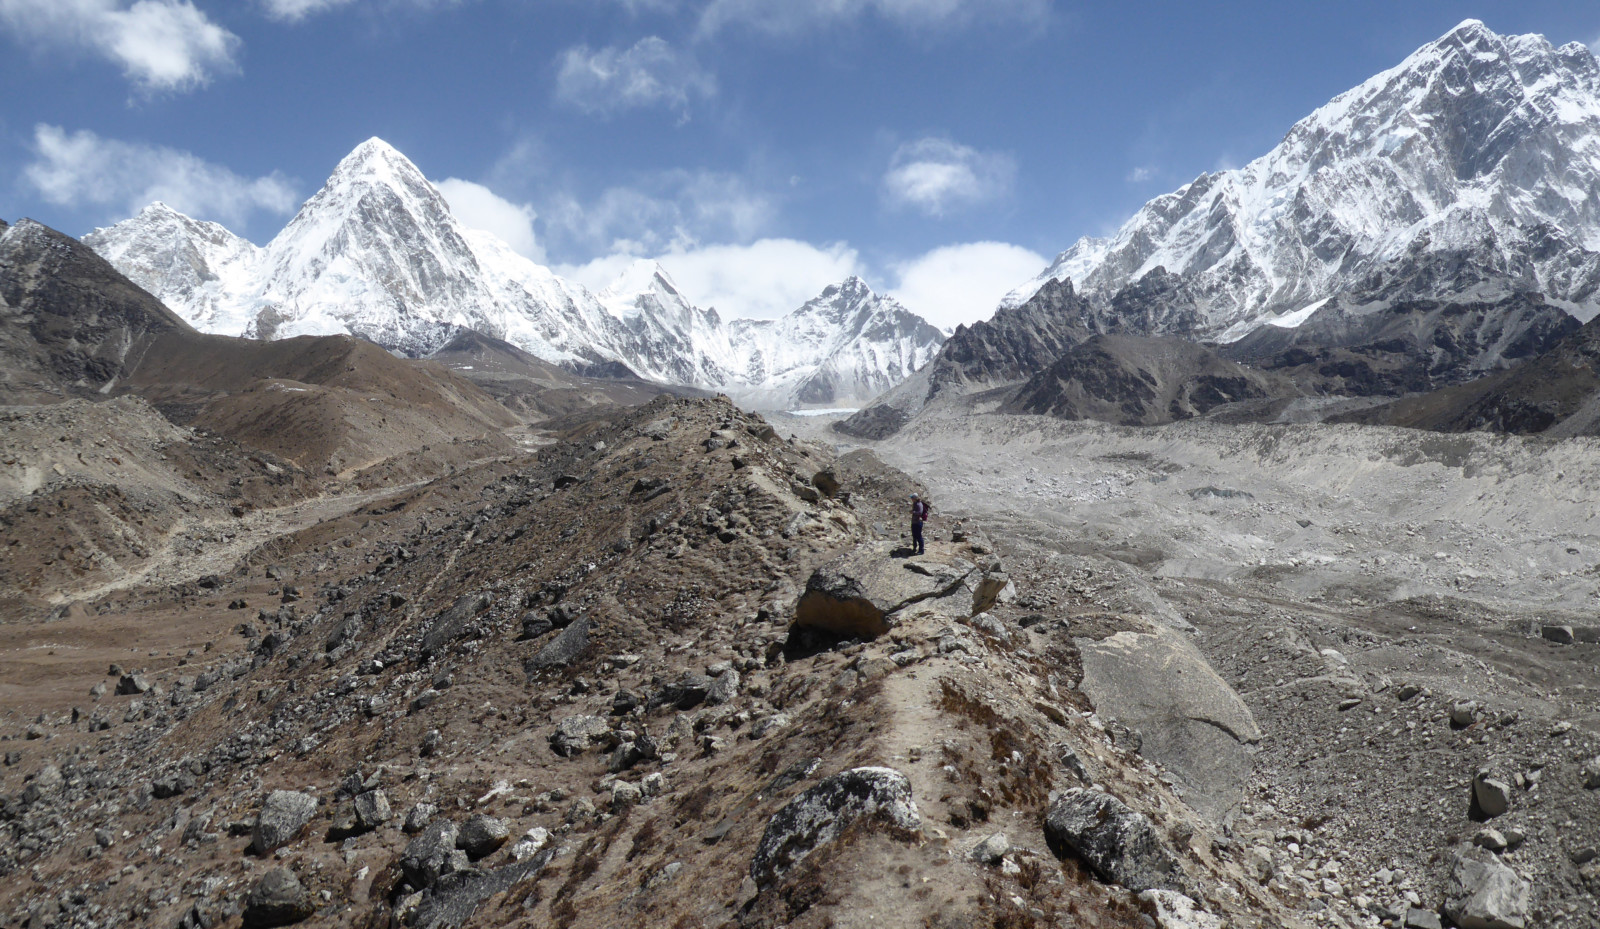
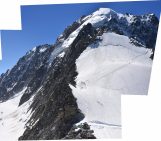
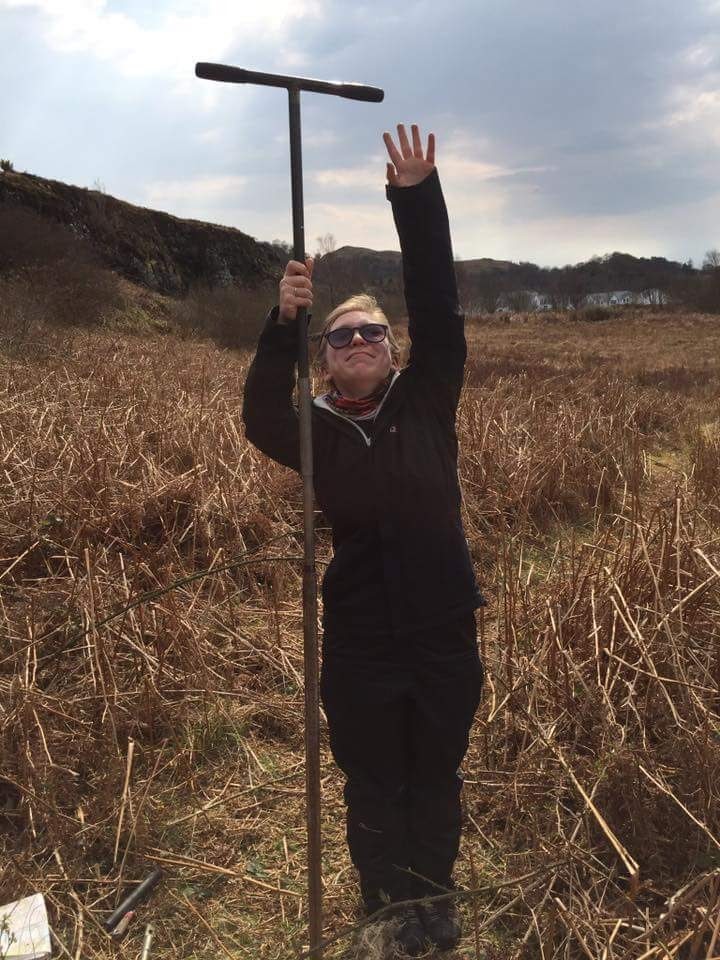
Figure 3 – Looking back up the valley whilst I contemplate a rock. Pumori summit can be seen to the left of the photograph, and Nuptse summit can be seen on the right. Existential questions on a postcard please. [Credit: Martin Kirkbride]
Further Reading
- Ann Rowan, 2018. GeologyToday, ‘Mountain glaciers under a changing climate’
- King et al., 2017. The Cryosphere, ‘Spatial variability in mass loss of glaciers in the Everest region, central Himalayas, between 2000 and 2015’
- Image of the Week – We walked the Talk to Everest
- Image of the Week – Climbing Everest and highlighting science in the mountains
- Image of the Week – Far-reaching implications of Everest’s thinning glaciers
- Image of the Week – Fieldwork at 5,000 meters in altitude
- Finkel et al., 2003. Geology, Beryllium-10 dating of Mount Everest moraines indicates a strong monsoonal influence and glacial synchroneity throughout the Himalaya.
- Richards et al., 2000. Geological Society of America Bulletin, Timing of Late Quaternary glaciations south of Mount Everest in the Khumbu Himal, Nepal.
Edited by Scott Watson
 Jo Hornsey is a PhD student at the Department of Geography in Sheffield, UK. She is researching the changing extent of Himalayan glaciers over the last 2500 years with specific focus on the Little Ice Age event ~500 years ago; dating the patterns of glacier retreat in the Khumbu Valley; using this information to improve accuracy of the iSOSIA model; and applying IPCC Climate Scenarios to analyse future glacier behaviour in the Khumbu Valley. In her downtime she can be found walking, climbing, running, acting, playing Dungeons and Dragons, and invariably trying to show you pictures of her cats.
Twitter – @joshornsey
Email – jhornsey1@sheffield.ac.uk