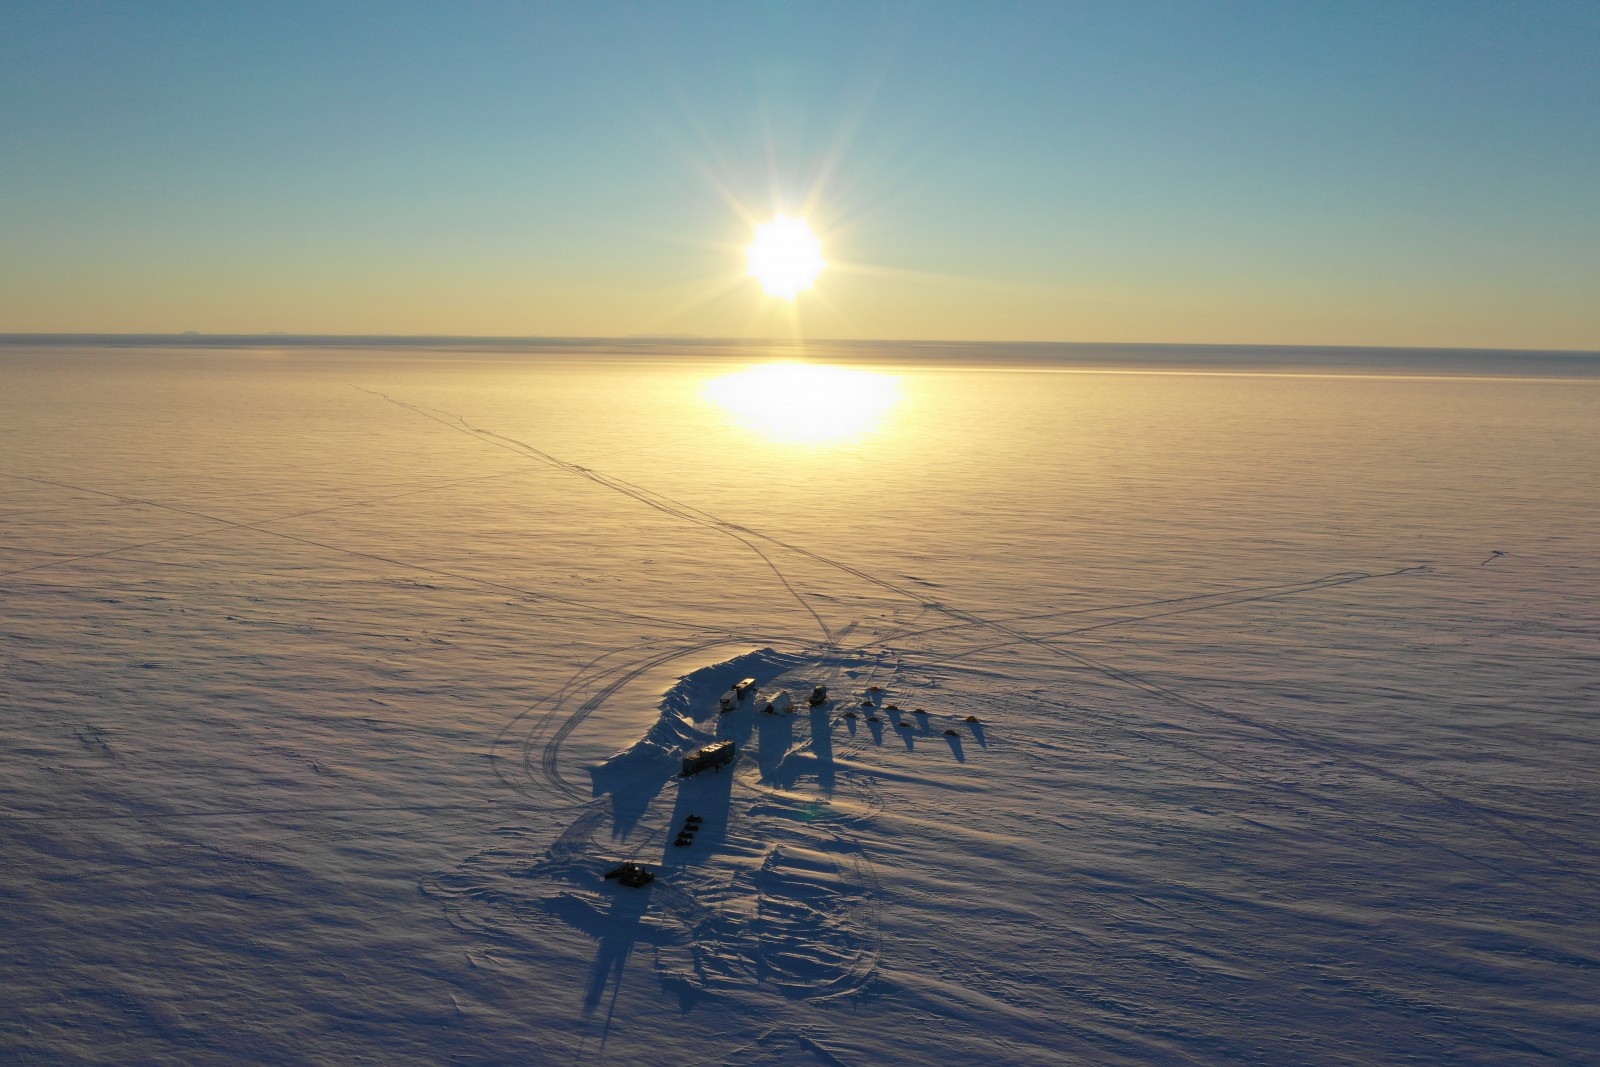
Figure 1 – Drone picture of our field camp in the Princess Ragnhild coastal region, East Antarctica. [Credit: Nander Wever]
After only two months of PhD at the Laboratoire de Glaciologie of the Université libre de Bruxelles (ULB, Belgium), I had the chance to participate in an ice core drilling campaign in the Princess Ragnhild coastal region, East Antarctica, during seven weeks in December 2018 – January 2019 for the Mass2Ant project. Our goal was to collect ice cores to better evaluate the evolution of the surface mass balance in the Antarctic Ice sheet. Despite the sometimes-uncomfortable weather conditions, the ins and outs of the fieldwork and the absence of friends and family, these seven weeks in Antarctica were a wonderful experience…
Mass2Ant
Mass2Ant is the acronym of the project: “East Antarctic surface mass balance in the Anthropocene: observations and multiscale modelling”. This project aims to better understand the processes controlling the surface mass balance in East Antarctica, its variability in the recent past and, ultimately, improve the projections of mass balance changes of the East Antarctic ice sheet.
What exactly is the surface mass balance?
The mass balance of an ice sheet (see Fig. 2) is the net balance between the mass gained by snow accumulation and the loss of mass by melting (either at the surface or under the floating ice shelves) and calving (breaking off of icebergs at the ice shelves fronts).
The surface mass balance on the other hand only considers the surface of the ice sheet. It is thus, for a given location, the difference between:
- incoming mass: snowfall, and
- outgoing mass, due to melting processes (fusion and sublimation), meltwater runoff and transport or erosion by wind at the ice sheet interface.
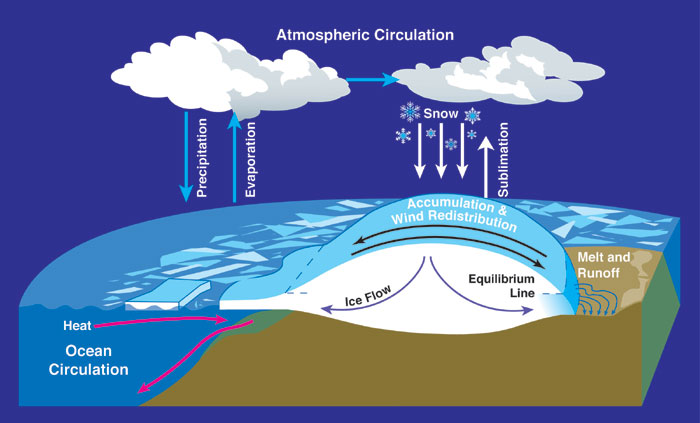
Figure 2 – Representation of the mass balance of an ice sheet [Credit: Figure adapted from NASA, Wikimedia Commons].
Overall, the ice sheet mass balance – the principal indicator of the “health state” of an ice sheet – is the balance between the surface mass balance, iceberg calving and basal melt under the ice shelves. A good evaluation of these three factors is thus essential to better quantify the evolution of the Antarctic mass balance under anthropogenic warming and therefore its contribution to future sea level rise.
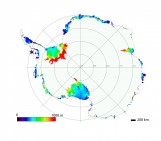
However, the surface mass balance is characterized by strong temporal and spatial variations (see Figure 3) and is poorly constrained. In order to improve future projections for Antarctica, it is essential to better assess the variability of the Antarctic surface mass balance by directly collecting data in the field. Within this framework, the goal of the Mass2Ant project is to study the surface mass balance in the Princess Ragnhild coastal region (marked in the Figure 3).
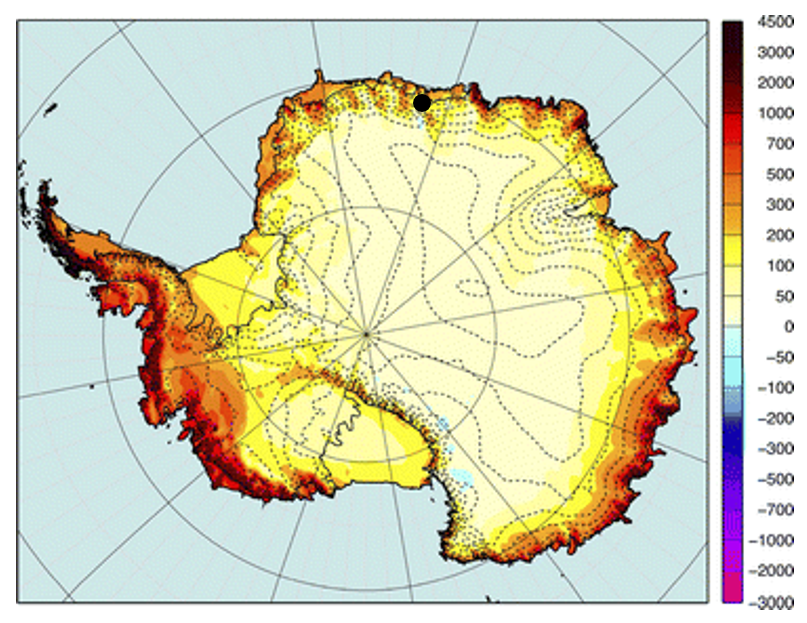
Figure 3 – Surface mass balance (1989-2009) from RACMO2 (a regional climate model) of Antarctica (left) and Greenland (right) in kg/m².yr. Contour levels (dashed) are shown every 500 m. Black dot is the approximative position of the drilling site on the Tison Ice Rise. [Credit: adapted from Figure 1 of van den Broeke et al. (2011)].
Collecting the data [or how can we use ice cores to infer surface mass balance?]
Surface mass balance can be determined by analyzing ice core records. As a part of our expedition, ice cores were collected on the summit of the so-called “Tison Ice Rise” (a non-official name) – 70°S 21°E, near the Belgian Princess Elisabeth Station. We drilled to a depth of 260.1 m, which we expect to date back to the 15th century.
The drilling system, named the Eclipse drill, contains a motor on top of a drill barrel – which is composed of an inner barrel that cuts the ice core with 3 knives and collects it and an outer barrel (a tube) that collects the chips created. Due to the overlaying ice, pressure increases very quickly with depth. Deep ice cores are thus subject to much higher pressure than the atmospheric pressure. In order to reduce these strong pressure differences as the ice core is brought to the surface, drilling fluid was poured in the boreholes, a technique called “wet-drilling”. This was the first time the wet-drilling technique was used by our team, and it significantly improved the quality of our ice cores compared to the traditional method used during the previous campaigns!
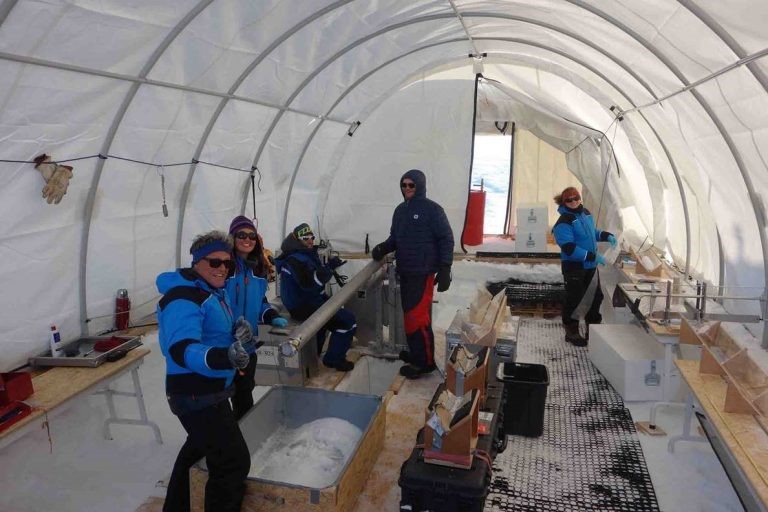
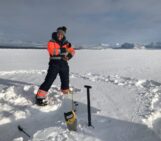
Figure 4 – A part of our team in the drilling tent. An ice core can be observed in the inner barrel of the drilling system. A wooden box is placed on top of the trench, under the drill barrel to collect the chips contained in the outer barrel. [Credit: Hugues Goosse]
The 329 collected ice cores will be analyzed in our lab in Brussels. More specifically, we will focus on
- the water stable isotopes: the seasonal cycle of stable isotopes of water in ice will be used for relative dating of the ice core;
- the major ions (Na+, nssSO4, Na+/SO42-, NO3–…) present in the ice: the reconstruction of the seasonal cycle of these ions allows us to refine the isotopic dating and therefore infer the annual snow/firn/ice thickness.
- the conductivity of the ice, which also shows a clear seasonal signal used for dating. Moreover, the conductivity signal is also reacting to localized extra inputs – for example from past volcanic eruptions – therefore providing an absolute dating, which reduces our dating method uncertainties.
The seasonality of these signals will allow us to infer the yearly ice thicknesses (see this post). By taking into account the deformation of the ice, we will then be able to reconstruct the evolution of the surface mass balance in the Princess Ragnhild Coast region since the 15th century.
Life in the field
What was a typical day like for us? In fact, it strongly depended on the team to which you belonged as we were divided into two groups:
- The “day group” was working on measurements such as snow density and radar analyses and worked roughly between 8 AM and 8 PM.
- The second group – the drilling team, including me – worked during nights (between 9 PM and 9 AM) because of the too high temperatures during day, which would lead to ice core melt.
The drilling team adapted quite easily to this timing as the sun was shining 24 hours a day. In order to spend a common moment, a joint meal was organized every day at 8.30 AM, with some of us having their dinner while others were having breakfast.
The everyday life mainly occurred in two equipped containers. The first container was our living space, which we used as kitchen, dining room and working space. The second container consisted of a cloakroom, the toilets and the bathroom (with a real shower, a luxury in the field!). Each of us had a tent to sleep, with adapted sleeping bag, making it quite comfortable. As we stayed 5 weeks at the drilling site, we spent Christmas and New Year’s Eve on the field. It was a good occasion to eat fondue while sharing some fun stories and jokes (Fig. 5).
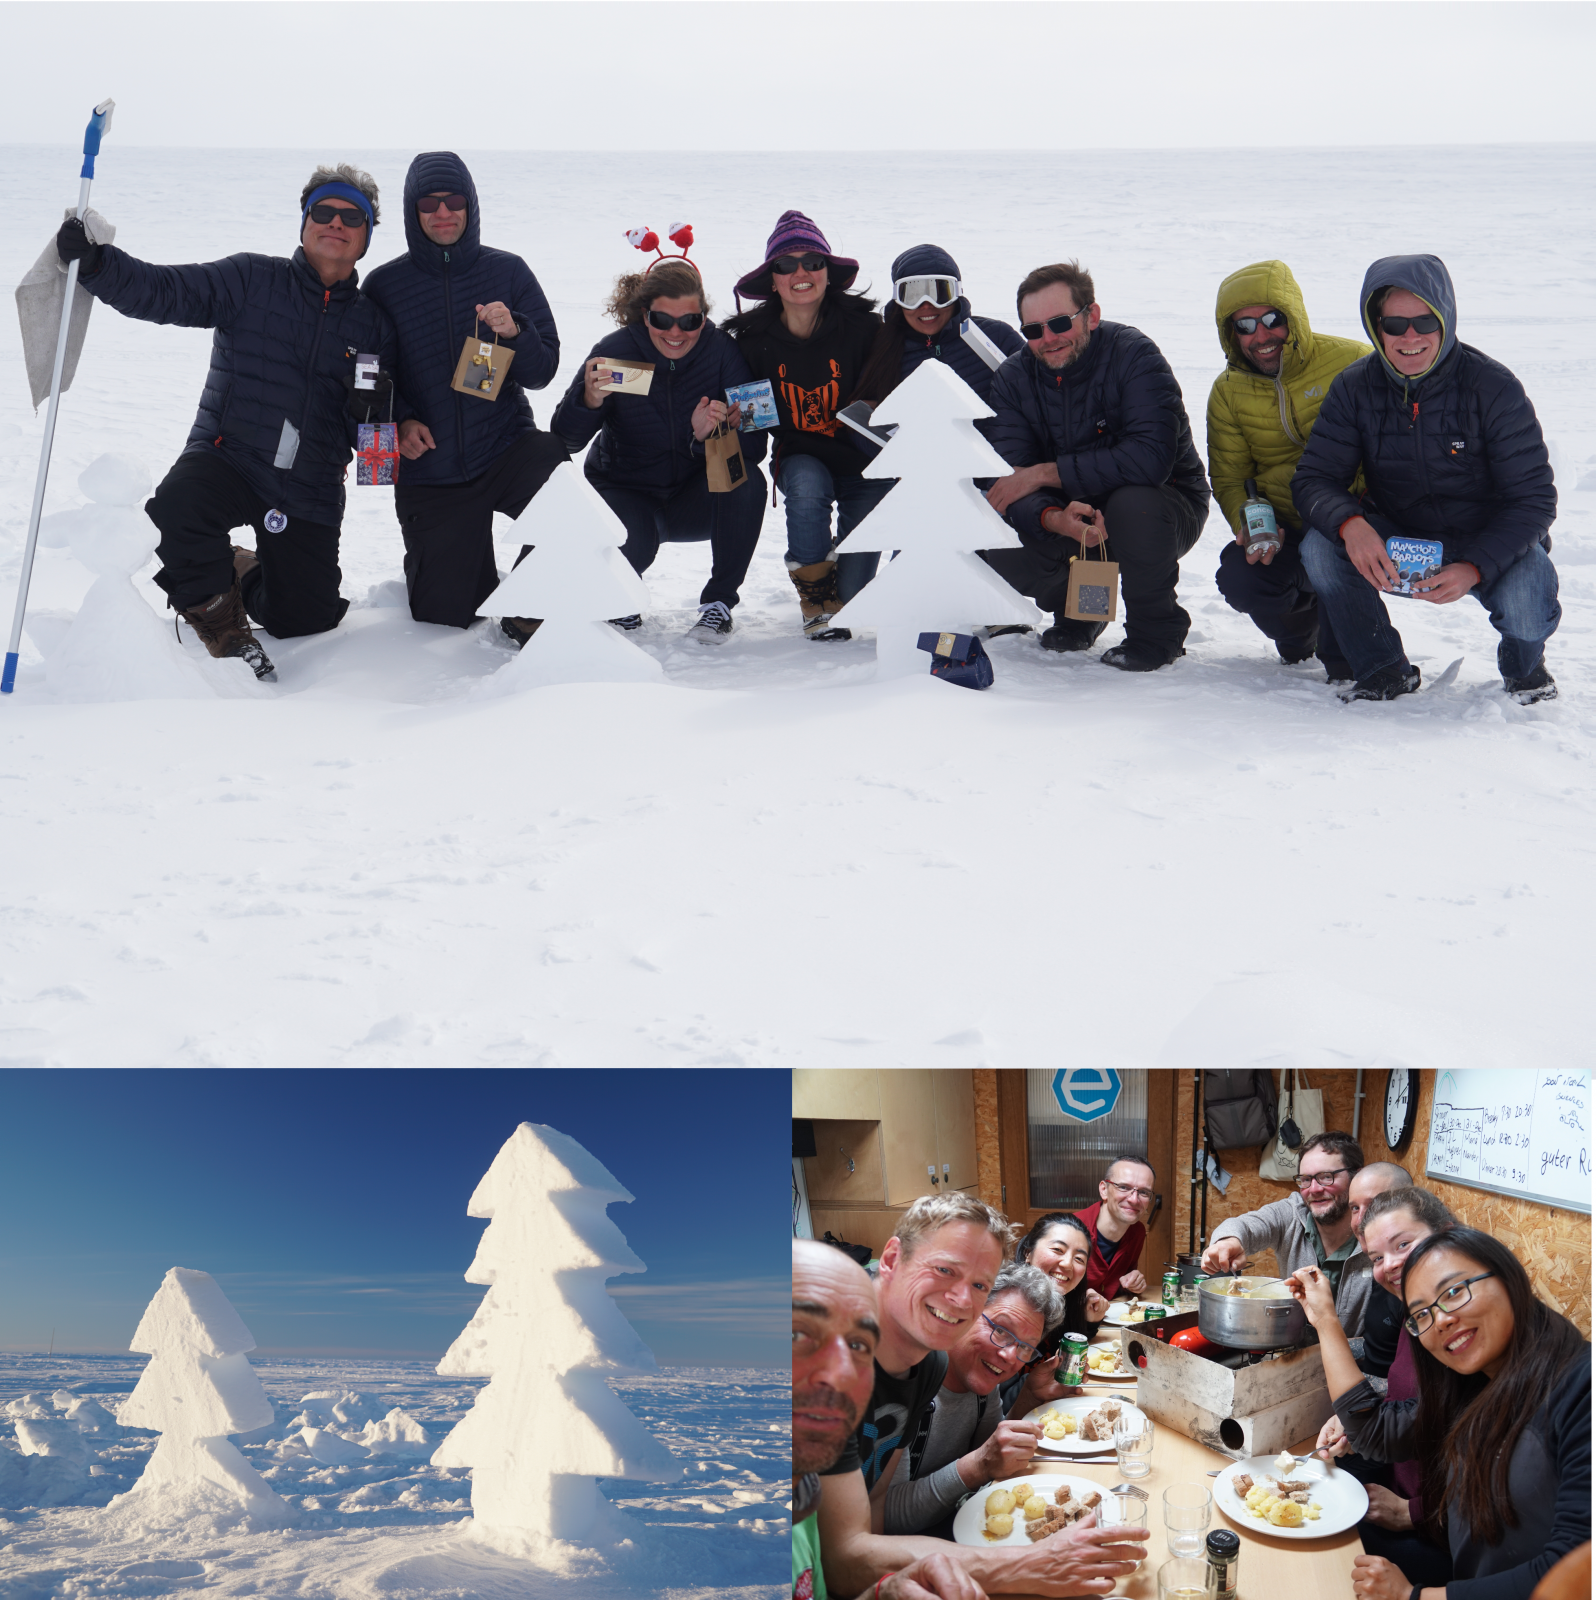
Figure 5 – Christmas time spent together, giving presents and eating fondue. [Credit: Nander Wever]
Why should you too go to Antarctica?
I’ll keep many memories of the time we all spent together, but also of the amazing landscapes and the calm and peacefulness of this white immensity… Despite the sometimes-uncomfortable weather conditions (a full week of whiteout days, lucky us!), this unique experience was wonderful! I’ve learned so much, from a scientific but also personal point of view. It was also a chance to participate in the collection of the samples that I will study during the next four years of my PhD. Before I left for Antarctica, someone told me that “When you went to Antarctica once, you usually want to go again”. Well, that’s definitely true for me!
Many thanks to belspo for funding this project, to the International Polar Foundation and Princess Elisabeth Antarctica staffs for the work both in Cape Town and in the station, and last but not least, thanks to the Mass2Ant team in the field that made this experience an amazing adventure.
Further reading
- For more details on the mission but also on our daily life, have a look at our blog: bel-antar2018.be
- Philippe et al. (2016). Ice core evidence for a 20th century increase in surface mass balance in coastal Dronning Maud Land, East Antarctica. The Cryosphere, 10, 2501-2516. doi:10.5194/tc-10-2501-2016
- Ice Cores « For Dummies »
- What about Greenland’s surface mass balance? Go and check this Image of the Week
- Image of the Week – Antarctica: A decade of dynamic change
- Image of the Week — Quantifying Antarctica’s ice loss
Edited by Violaine Coulon
 Sarah Wauthy is a PhD student at Laboratoire de Glaciologie, Université Libre de Bruxelles, Belgium. Her PhD is part of the Mass2Ant project and aims at determining paleo-accumulation in the region of the Princess Ragnhild Coast (Dronning Maud Land, East Antarctica) as well as the paleo-extension of sea ice before and across the Anthropocene transition (ca. last 3 centuries), by performing high-resolution multiparametric analyses on ice cores collected during field campaigns.