The Greenland ice sheet – the world’s second largest ice mass – stores about one tenth of the Earth’s freshwater. If totally melted, this would rise global sea level by 7.4 m, affecting low-lying regions worldwide. Since the 1990s, the warmer atmosphere and ocean have increased the melt at the surface of the Greenland ice sheet, accelerating the ice loss through increased runoff of meltwater and iceberg discharge in the ocean.
Simulating the climate with a regional model
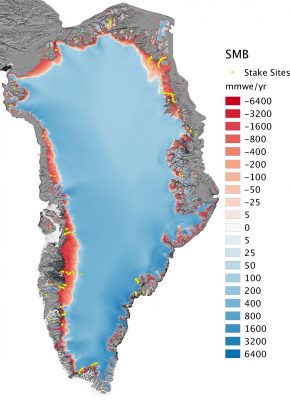
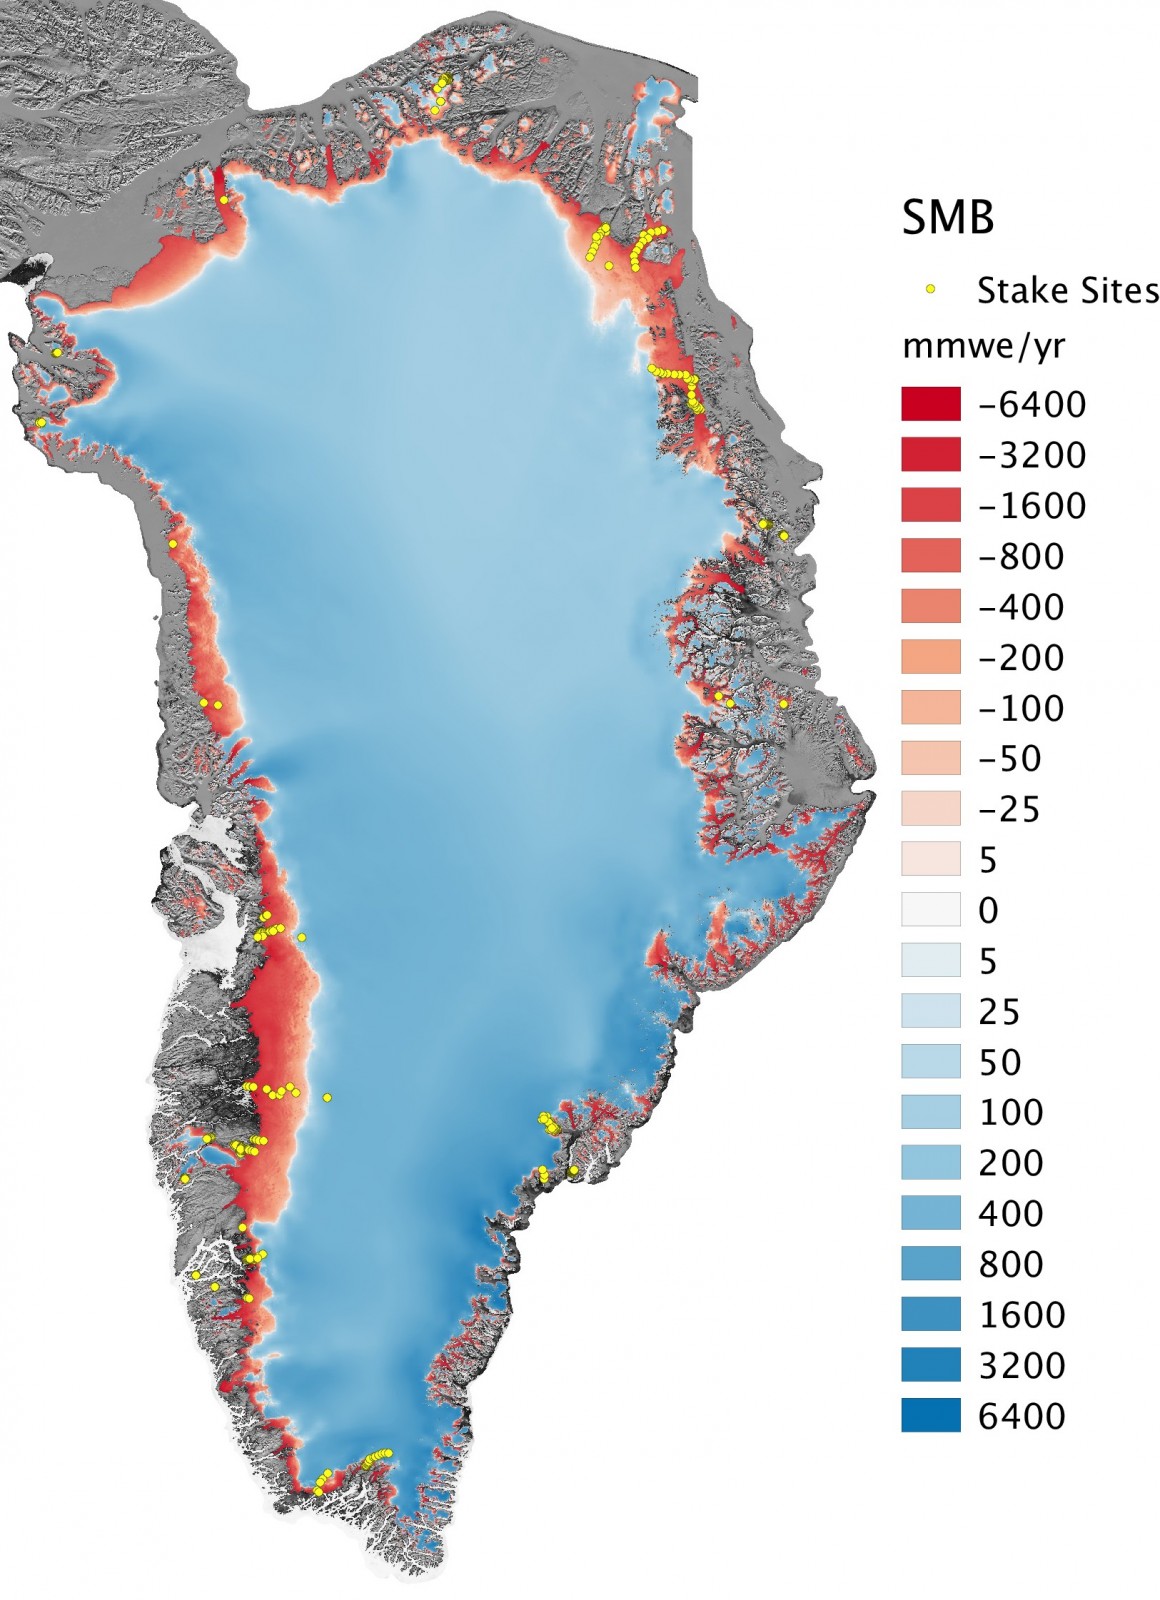
To understand the causes of the recent ice loss acceleration in Greenland, we use the Regional Atmospheric Climate Model RACMO2.3 (Noël et al. 2015) that simulates the evolution of the surface mass balance, that is the difference between mass gain from snowfall and mass loss from sublimation, drifting snow erosion and meltwater runoff. Using this data set, we identify three different regions on the ice sheet (Fig. 1):
-
the inland accumulation zone (blue) where Greenland gains mass at the surface as snowfall exceeds sublimation and runoff,
-
the ablation zone (red) at the ice sheet margins which loses mass as meltwater runoff exceeds snowfall.
-
the equilibrium line (white) that separates these two areas.
From 11 km to 1 km : downscaling RACMO2.3
To cover large areas while overcoming time-consuming computations, RACMO2.3 is run at a relatively coarse horizontal resolution of 11 km for the period 1958-2015. At this resolution, the model does not resolve small glaciated bodies (Fig. 2a), such as narrow marginal glaciers (few km wide) and small peripheral ice caps (ice masses detached from the big ice sheet). Yet, these areas contribute significantly to ongoing sea-level rise. To solve this, we developed a downscaling algorithm (Noël et al., 2016) that reprojects the original RACMO2.3 output on a 1 km ice mask and topography derived from the Greenland Ice Mapping Project (GIMP) digital elevation model (Howat et al., 2014). The downscaled product accurately reproduces the large mass loss rates in narrow ablation zones, marginal outlet glaciers, and peripheral ice caps (Fig. 2b).
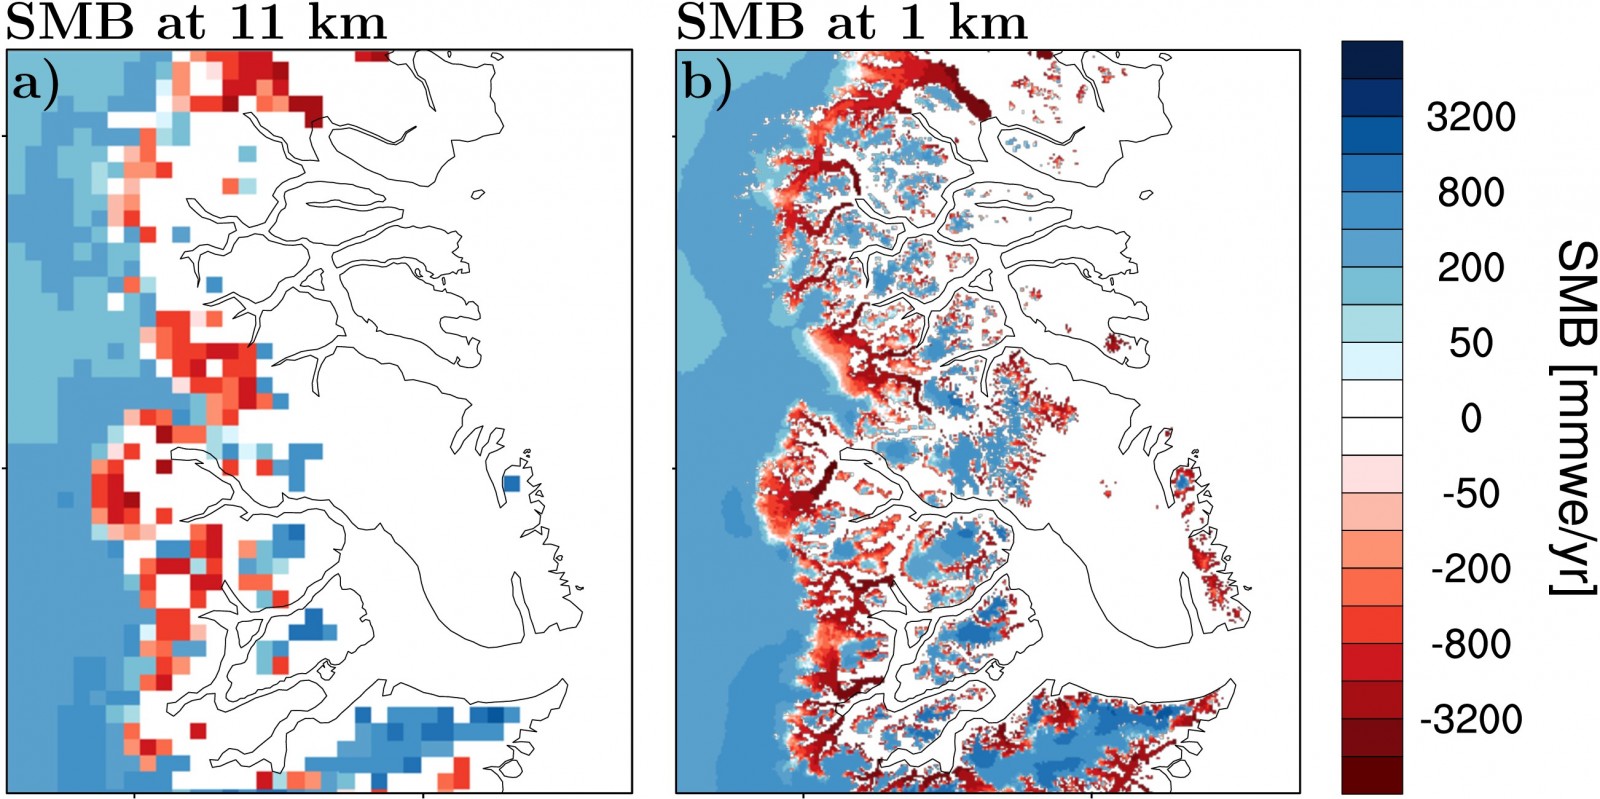
Fig. 2: Surface mass balance (SMB) of central east Greenland a) modelled by RACMO2.3 at 11 km, b) downscaled to 1 km (1958-2015). The 1 km product (b) resolves the large mass loss rates over marginal outlet glaciers [Credit: Brice Noël].
The high-resolution data set has been successfully evaluated using in situ measurements and independent satellite records derived from ICESat/CryoSat-2 (Noël et al., 2016, 2017). Recently, the downscaling method has also been applied to the Canadian Arctic Archipelago, for which a similar product is now also available on request.
Endangered peripheral ice caps
Using the new 1 km data set (Fig. 1), we identified 1997 as a tipping point for the mass balance of Greenland’s peripheral ice caps (Noël et al., 2017). Before 1997, ablation (red) and accumulation zones (blue) were in approximate balance, and the ice caps remained stable (Fig. 3a). After 1997, the accumulation zone retreated to the highest sectors of the ice caps and the mass loss accelerated (Fig. 3b). This mass loss acceleration was already reported by ICESat/CryoSat-2 satellite measurements, but no clear explanation was provided. The 1 km surface mass balance provides a valuable tool to identify the processes that triggered this recent mass loss acceleration.
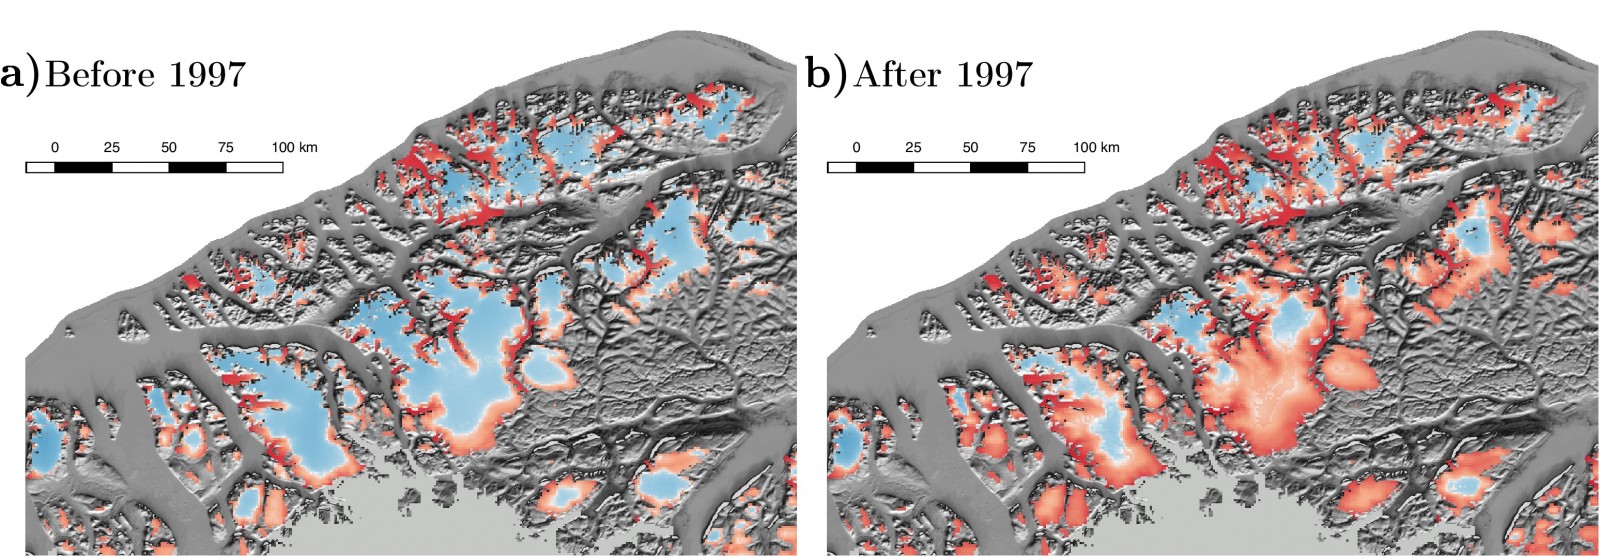
Fig. 3: Surface mass balance of Hans Tausen ice cap and surrounding small ice bodies in northern Greenland before (a) and after the tipping point in 1997 (b). Since 1997, the accumulation zone (blue) has shrunk and the ablation zone (red) has grown further inland, tripling the pre-1997 mass loss [Credit: Brice Noël].
Greenland ice caps are located in relatively dry regions where summer melt (ME) nominally exceeds winter snowfall (PR). To sustain the ice caps, refreezing of meltwater (RF) in the snow is therefore a key process. The snow acts as a “sponge” that buffers a large amount of meltwater which refreezes in winter. The remaining meltwater runs off to the ocean (RU) and contributes to mass loss (Fig. 4a).
Before 1997, the snow in the interior of these ice caps could compensate for additional melt by refreezing more meltwater. In 1997, following decades of increased melt, the snow became saturated with refrozen meltwater, so that any additional summer melt was forced to run off to the ocean (Fig. 4b), tripling the mass loss.
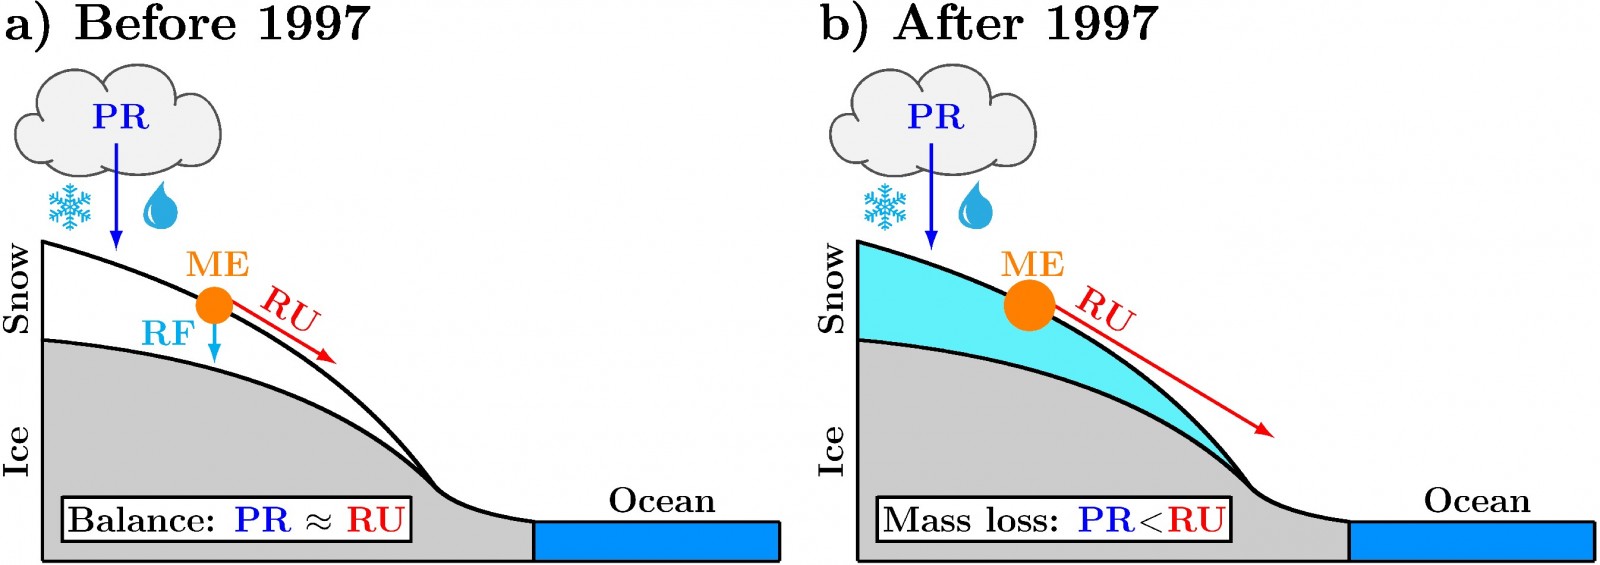
Fig. 4: Surface processes on an ice cap: the ice cap gains mass from precipitation (PR), in the form of rain and snow. a) In healthy conditions (e.g. before 1997), meltwater (ME) is partially refrozen (RF) inside the snow layer and the remainder runs off (RU) to the ocean. The mass of the ice cap is constant when the amount of precipitation equals the amount of meltwater that runs off. b) When the firn layer is saturated with refrozen meltwater, additional meltwater can no longer be refrozen, causing all meltwater to run off to the ocean. In this case, the ice cap loses mass, because the amount of precipitation is smaller than the amount of meltwater that runs off [Credit: Brice Noël].
In 1997, following decades of increased melt, the snow became saturated with refrozen meltwater, so that any additional summer melt was forced to run off to the ocean, tripling the mass loss.
We call this a “tipping point” as it would take decades to regrow a new, healthy snow layer over these ice caps that could buffer enough summer meltwater again. In a warmer climate, rainfall will increase at the expense of snowfall, further hampering the formation of a new snow cover. In the absence of refreezing, these ice caps will undergo irreversible mass loss.
What about the Greenland ice sheet?
For now, the big Greenland ice sheet is still safe as snow in the extensive inland accumulation zone still buffers most of the summer melt (Fig. 1). At the current rate of mass loss (~300 Gt per year), it would still take 10,000 years to melt the ice sheet completely (van den Broeke et al., 2016). However, the tipping point reached for the peripheral ice caps must be regarded as an alarm-signal for the Greenland ice sheet in the near future, if temperatures continue to increase.
Data availability
The daily, 1 km Surface Mass Balance product (1958-2015) is available on request without conditions for the Greenland ice sheet, the peripheral ice caps and the Canadian Arctic Archipelago.
Further reading
-
Greenland ice caps | Web story
-
About RACMO2.3 (11 km in Greenland) :
Noël, B., van de Berg, W. J., van Meijgaard, E., Kuipers Munneke, P., van de Wal, R. S. W., and van den Broeke, M. R.: Evaluation of the updated regional climate model RACMO2.3: summer snowfall impact on the Greenland Ice Sheet, The Cryosphere, 9, 1831-1844, doi:10.5194/tc-9-1831-2015, 2015. -
About the downscaling technique:
Noël, B., van de Berg, W. J., Machguth, H., Lhermitte, S., Howat, I., Fettweis, X., and van den Broeke, M. R.: A daily, 1 km resolution data set of downscaled Greenland ice sheet surface mass balance (1958–2015), The Cryosphere, 10, 2361-2377, doi:10.5194/tc-10-2361-2016, 2016. -
About the process of snow saturation :
Noël, B., van de Berg, W. J., Lhermitte, S., Wouters, B., Machguth, H., Howat, I., Citterio, M., Moholdt, G., Lenaerts, J.T.M., van den Broeke, M. R.: A tipping point in refreezing accelerates mass loss of Greenland’s glaciers and ice caps, Nature Communications, 8, 14730, doi:10.1038/ncomms14730, 2017.
Edited by Sophie Berger
 Brice Noël is a PhD Student at IMAU (Institute for Marine and Atmospheric Research at Utrecht University), Netherlands. He simulates the climate of the Arctic region, including the ice masses of Greenland, Svalbard, Iceland and the Canadian Arctic, using the regional climate model RACMO2. His main focus is to identify snow/ice processes affecting the surface mass balance of these ice-covered regions. He tweets as: @BricepyNoel Contact Email: b.p.y.noel@uu.nl
Pingback: Cryospheric Sciences | Image of the Week – Seven weeks in Antarctica [and how to study its surface mass balance]