Every year again, the Conference of Parties takes place, an event where politicians and activists from all over the world meet for two weeks to discuss further actions concerning climate change. In the context the COP24, which started this Monday in Katowice (Poland), let’s revisit an important decision made three years ago, during the COP21 in Paris, and its consequences for the state of the cryo ...[Read More]
Image of the Week – (Un)boxing the melting under the ice shelves
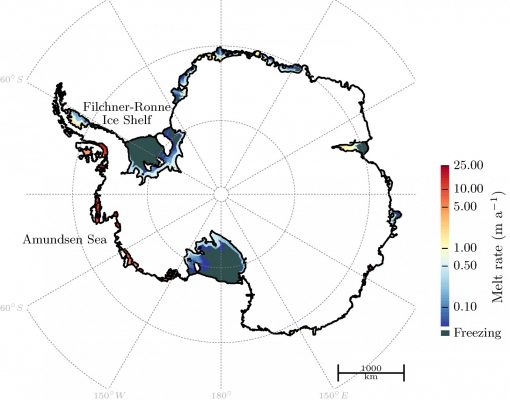
Figure 1: Melting underneath Antarctic ice shelves as modelled with the Potsdam Ice-shelf Cavity mOdel (PICO) for present-day ice geometries and ocean conditions. Extending a simple ocean box model approach (Olbers and Hellmer, 2010), it efficiently calculates the wide range of melting in Antarctica [Credit: adapted from Fig. 5 of Reese et al. (2018)]
The Antarctic ice sheet stores a large amount of water that could potentially add to sea level rise in a warming world (see this post and this post). It is currently losing ice, and the ice loss has been accelerating in the past decades. All this is linked to the melting of ice – not at the surface but at the base, underneath the so-called ice shelves which form the continuation of the Antarctic i ...[Read More]
Image of the Week – Breaking the ice: river ice as a marker of climate change
Common images associated with climate change include sad baby polar bears, a small Arctic sea ice extent, retreating glaciers, and increasing severe weather. Though slightly less well-known, river ice is a hydrological system which is directly influenced by air temperature and the amount and type of precipitation, both of which are changing under a warming climate. Ice impacts approximately 60 % o ...[Read More]
Image of the Week – Karthaus Summer School 2018
Nearly every year since the late 90s, during the summer, the picturesque Karthaus has hosted 10-day glaciology course. This school is a platform for glaciologists to explore, learn and expand their knowledge base. This helps researchers become multi-faceted: to view glaciology from the perspective of those specializing in other backgrounds such as hydrology, geomorphology, oceanography, etc. which ...[Read More]
Image of the Week – Promoting interdisciplinary science in the Arctic: what is IASC?
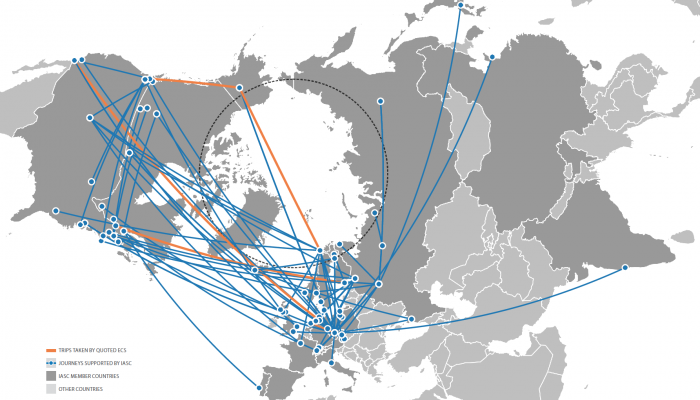
IASC, the International Arctic Science Committee, is more than your regular committee. IASC connects Arctic scientists from 23 member countries and countless disciplines in order to promote and support impactful multi- and interdisciplinary Arctic research. IASC aims to foster a greater scientific understanding of the Arctic region and its role in the Earth system [Credit: IASC].
The Arctic is one of the fastest changing regions on the Earth, where climate change impacts are felt both earlier and more strongly than elsewhere in the world. As an integral part of the Earth system, the Arctic is shaped by global processes, and in turn, Arctic processes influence the living conditions of hundreds of millions of people at lower latitudes. No one country or community can underst ...[Read More]
Image of the Week – Alien-iced
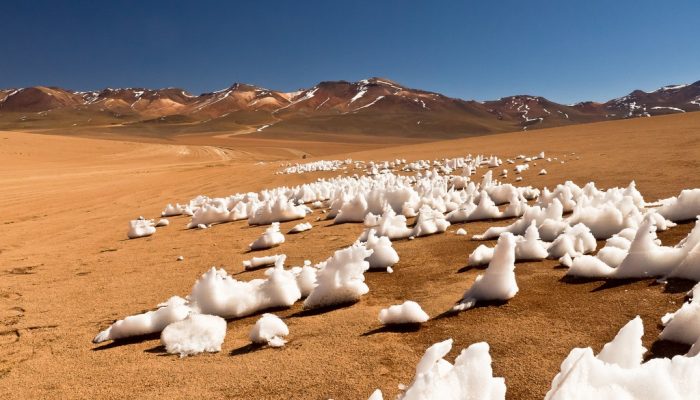
Penitentes in the Bolivian Andes at an altitude of around 4400 m [Credit: Christoph Schmidt (distributed via imaggeo.egu.eu)]
What do Chile and Jupiter’s moon Europa have in common? If you like astronomy, you may reply “space missions!” – Chile’s dry air and clear skies make it an ideal location for telescopes like the VLT or ALMA, while Europa’s inferred subsurface ocean will be studied by the upcoming mission to Jupiter JUICE, due to launch in 2022. But Chile’s high altitude Atacama desert and Europa’s frozen surface a ...[Read More]
Do clouds affect melting over Antarctic ice shelves?
The Antarctic Peninsula is the ‘canary in the coalmine’ of Antarctic climate change. In the last half-century it has warmed faster than most other places on Earth, and considerable change has consequently been observed in the cryosphere, with several ice shelves collapsing in part or in full. Representing this change in models is difficult because we understand comparatively little abo ...[Read More]
Image of the Week – On thin [Arctic sea] ice
Perhaps the most enduring and important signal of a warming climate has been that the minimum Arctic sea ice extent, occurring each year in September, has declined precipitously. Over the last 40 years, most of the Arctic sea ice has thus been transformed to first-year ice that freezes in the winter and melts in the summer. Concern about sea ice extent and area is valid: since sea ice i ...[Read More]
Image of the Week — Cryo Connect: connecting cryosphere scientists and information seekers
Communicating scientific findings toward non-experts is a vital part of cryosphere science. However, when it comes to climate change and its impact, the gap between scientific knowledge and human action has never been so evident (see for instance, the publication of the latest IPCC special report). Today, our image of the week features an interview with Cryo Connect, a new initiative for more effi ...[Read More]
Image of the Week – Greenland’s fjords: critical zones for mixing
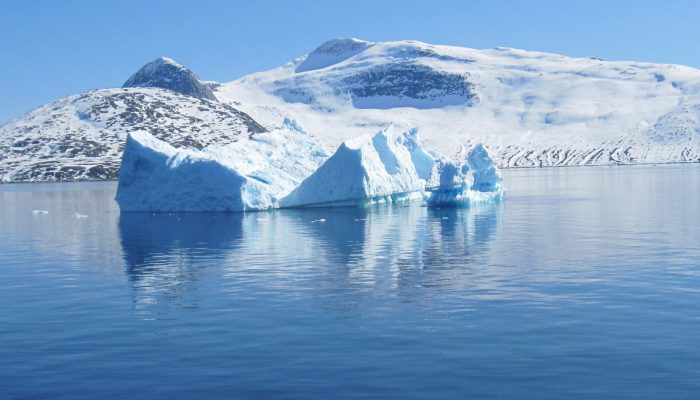
An iceberg melts in Godthåbsfjord, West Greenland [Credit: Thomas-Juul Pedersen].
One of the most challenging research questions to address in the Arctic is how freshwater discharge from Greenland’s largest glaciers affects the biogeochemistry of the ocean. Just getting close to the calving fronts of these large marine-terminating glaciers is difficult. Fjords, hundreds of kilometers long and full of icebergs which shift with the wind and roll as they melt, make the commute a l ...[Read More]