We know that climate change is affecting many aspects of what we have considered “stable” throughout a long period of modern times. One of many impacted and changing factors is snow and thereby also snow meltwater. One way to study meltwater is to trace it by the usage of stable water isotope signals and we plan to use it by asking: Are we underestimating the portions of snow meltwater in different snow affected environments when we use stable water isotope signals from precipitation as a proxy for melt? We think that is the case. Collecting meltwater from snow is challenging at any given day but the hard work seems to be paying off. Allow me to take you on a trip to Northern Finland where we test different setups for collecting meltwater from snow in the attempt to correct any bias that may exist.
The purpose of hunting for meltwater
Many of us care about where our water comes from. Whether it is for drinking or for watering our fields – we know that we depend on water for survival. That is why hydrologists are always trying to improve knowledge of and estimates about water availability and quality. One important and changing water source is that of snow and ice. The changing climate directly affects snow production, distribution, and its melt. We think it is important to better understand how these changes will affect water availability now and in the future. Stable water isotopes (δ2H and δ18O) can be used as a way of identifying different water sources, such as meltwater, in a similar way that fingerprints are used to identify people. We use stable water isotopes (SWI) to keep track of the evolution of the snow fingerprint as it changes between different stages (snowfall-snowpack-snowmelt). In this blog I want to introduce you to where we work and how we collect samples for our work.
Introducing the Pallas Catchment Site
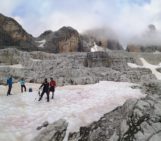
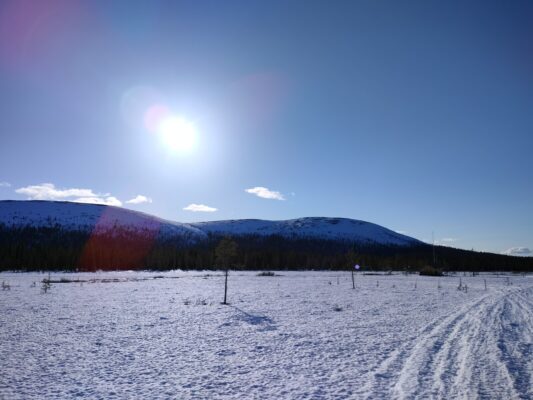
The Pallas Catchment site located about 130 km north of the Arctic Circle in the subarctic northwestern part of Finland and has been an active research site since 1935 (Marttila et al., 2021). In 2018, the University of Oulu, Finland, started investigating meltwater fingerprints in the Pallas Catchment Site near Muonio in northern Finland (Fig. 1 & 2). The goal was to identify where the meltwater travelled – as its fingerprint was not visible in the runoff water of the investigated areas. This became the foundation for the SNOMLT project which I am part of and which my fieldwork feeds into. If you would like to have a general introduction to the Catchment and the monitoring projects that are performed there, check out the blog post “Featured catchment series: The North is not forgotten!“. This post gives you an idea as well about the site and the conditions my work takes place in.
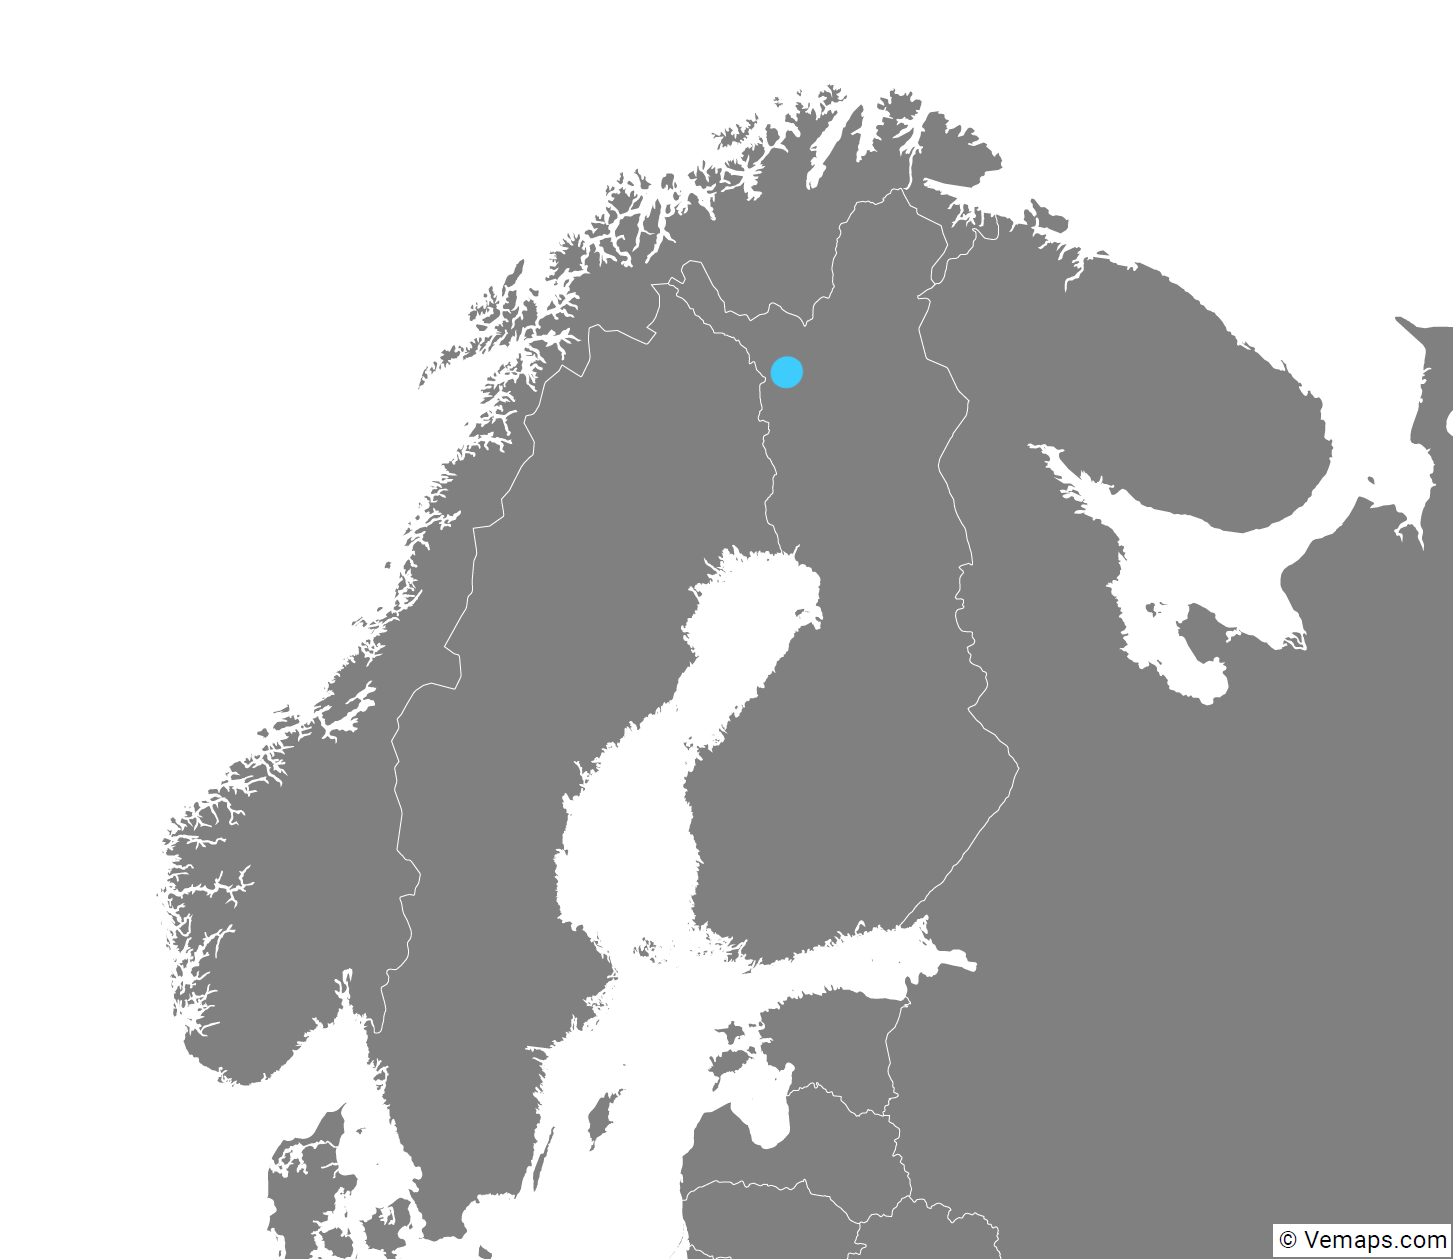
Figure 2: The Pallas catchment marked by the blue dot is at 68°N approximately 130 km north of the Arctic Circle. [Credits: Map created with Vemaps.com]
The SNOMLT Project: Correcting a Bias
As you already learned, SWI ratios can be used as fingerprints which allow us to trace the different water sources through the hydrological system. As of now many studies use the ratios of winter precipitation (snow) or snowpack for analyses meant to determine meltwater fractions in hydrograph separation (a method that shows how much water comes from different water bodies). But what happens when we use the wrong SWI ratios because the fingerprint has changed over time? What if the SWI ratios of snow changed as the snow underwent different stages such as going from its precipitative form (snowfall) to the accumulation stage (snowpack) ending with the final stage: meltwater (snowmelt). How would that affect the overall understanding of the role of snow meltwater? What initially started as a suspicion based on data was later confirmed by Noor et al. (2023). They showed that using SWI ratios of snow precipitation instead of snowmelt (leaving the snowpack) led to misleading portions. That typically undermined the fraction that comes from snow meltwater.
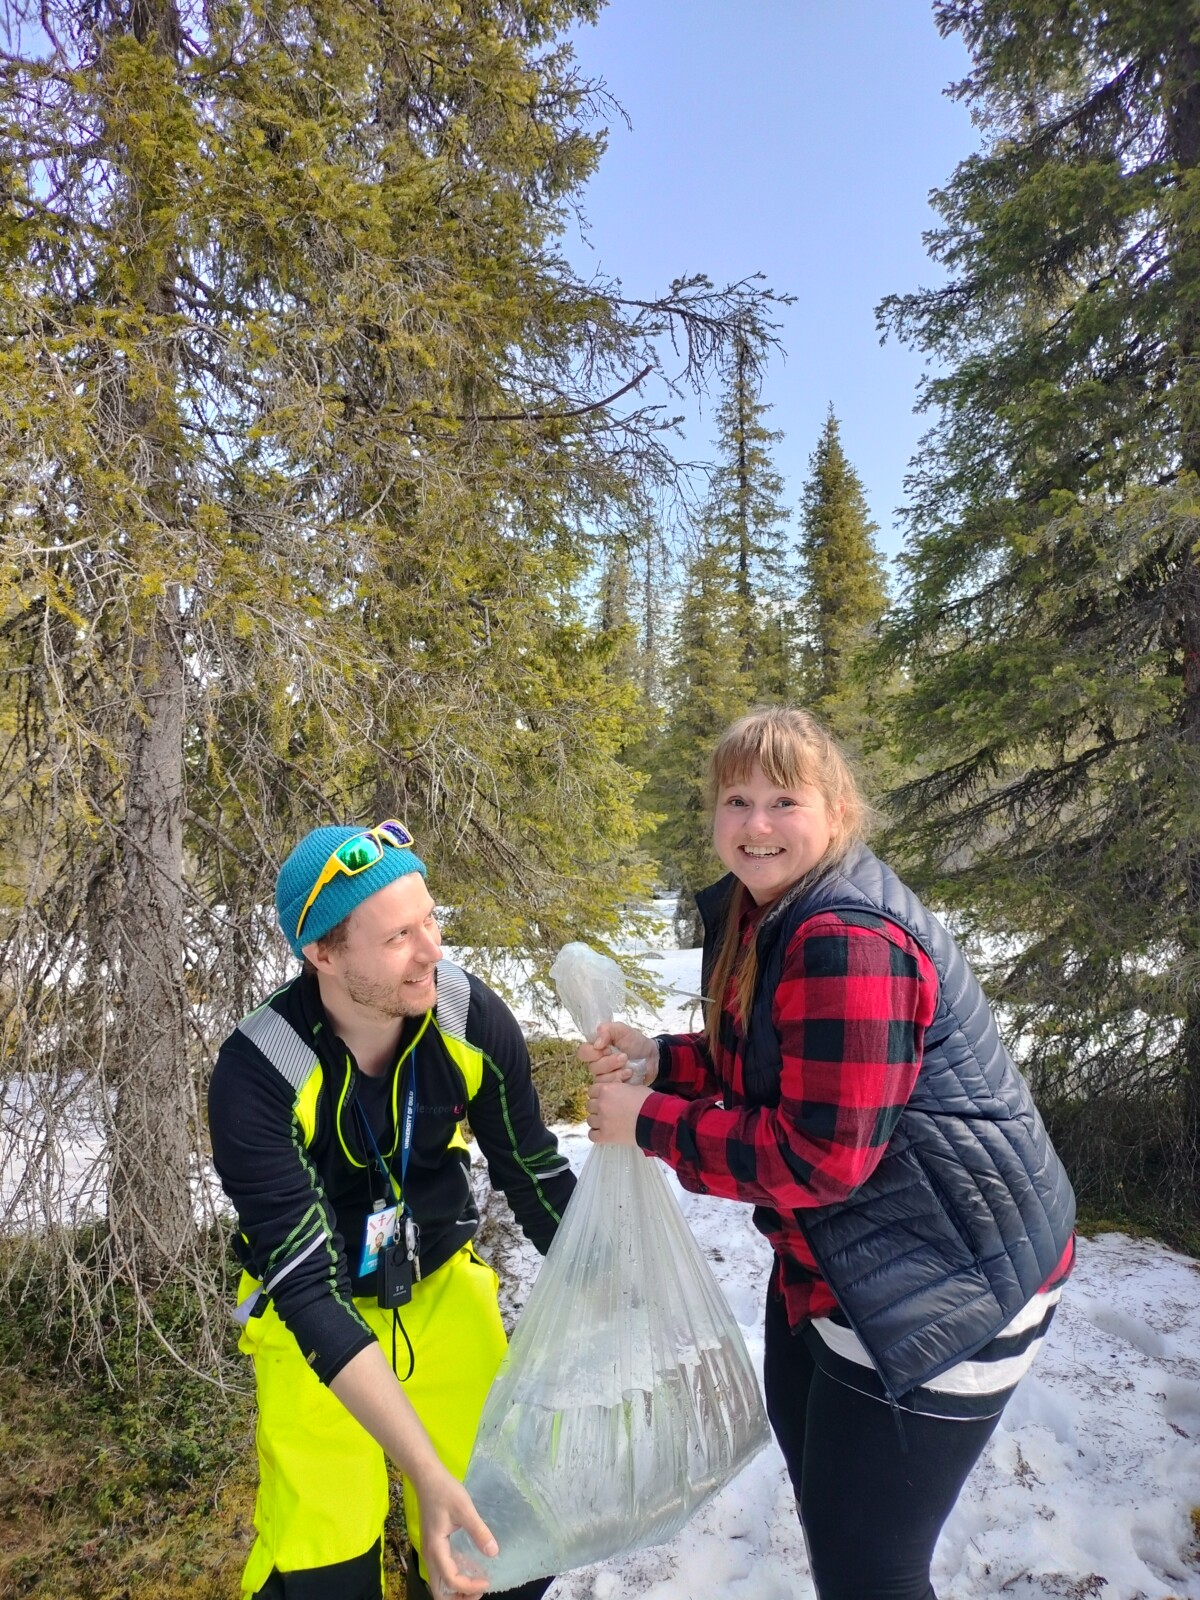
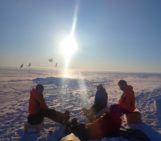
Figure 3: A relatively large meltwater sample collected by one of our lysimeters over a weekend in the northern part of Finland (Pallas). In the picture to the left is Joni Koivula and to the right Charlotte Ditlevsen. [Credits: Charlotte Benzaken]
Snow Lysimeters
The general idea with the snow lysimeter (Fig. 4 & 5) is that it should be installed before the snow arrives. Then snow is accumulated in the tray over winter and when it comes to the melt season, the meltwater is transported via the tube into a sample container of any kind where concealment is possible. We use a plastic bag which can easily be changed daily. In 2018, 11 snow lysimeters were installed in Pallas and have since been used to collect snowmelt samples every year.
The lysimeter works fairly well in both flat and slightly sloped environments. Using a high-walled lysimeter in areas with a high groundwater table could prevent contamination of the actual snowmelt sample.
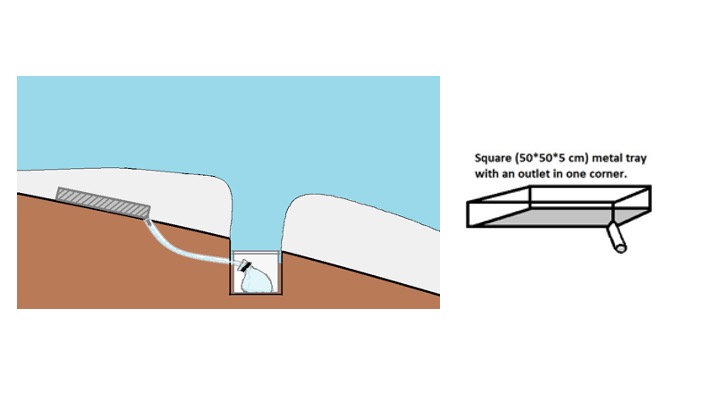
Figure 4: A conceptual drawing of the snow lysimeter setup to the left and drawing of the snow lysimeter and its dimensions to the right. [Credits: Charlotte Ditlevsen]
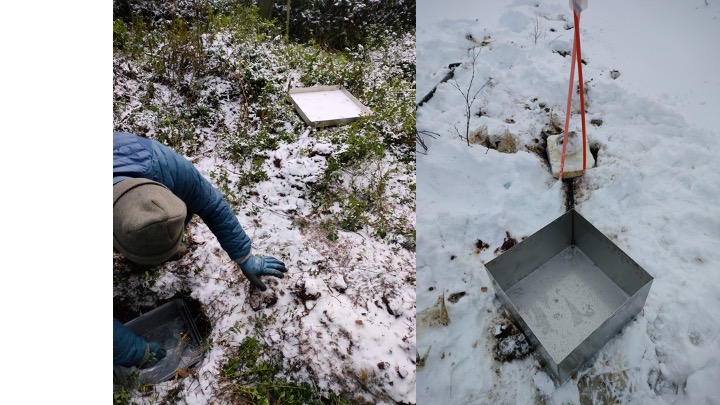
Figure 5: To the left a snow lysimeter setup and to the right a high-walled snow lysimeter in a mire. [Credits: Charlotte Ditlevsen]
Passive Capillary Sampler
The Passive Capillary Sampler (PCS) setup (Fig. 6, 7 & 8) works similar to the lysimeter. Only here there is a wick that sucks water from the melting snowpack and transfers it long its path into a sample container. The setup is based on descriptions by Penna et al. (2014). The main difference from the lysimeter is that it is possible to get away with no digging if there is a relatively high slope in the terrain to begin with. That potentially makes it a viable solution in permafrost regions (where you can’t really dig in the ground) as long as there are slopes available.
The setup consists of a number of fiberglass wicks which are placed on the ground. The wicks are placed in tubes which is dug into the ground (or left on top in case of the no-dig scenario) leading to a sampling box at a lover elevation.
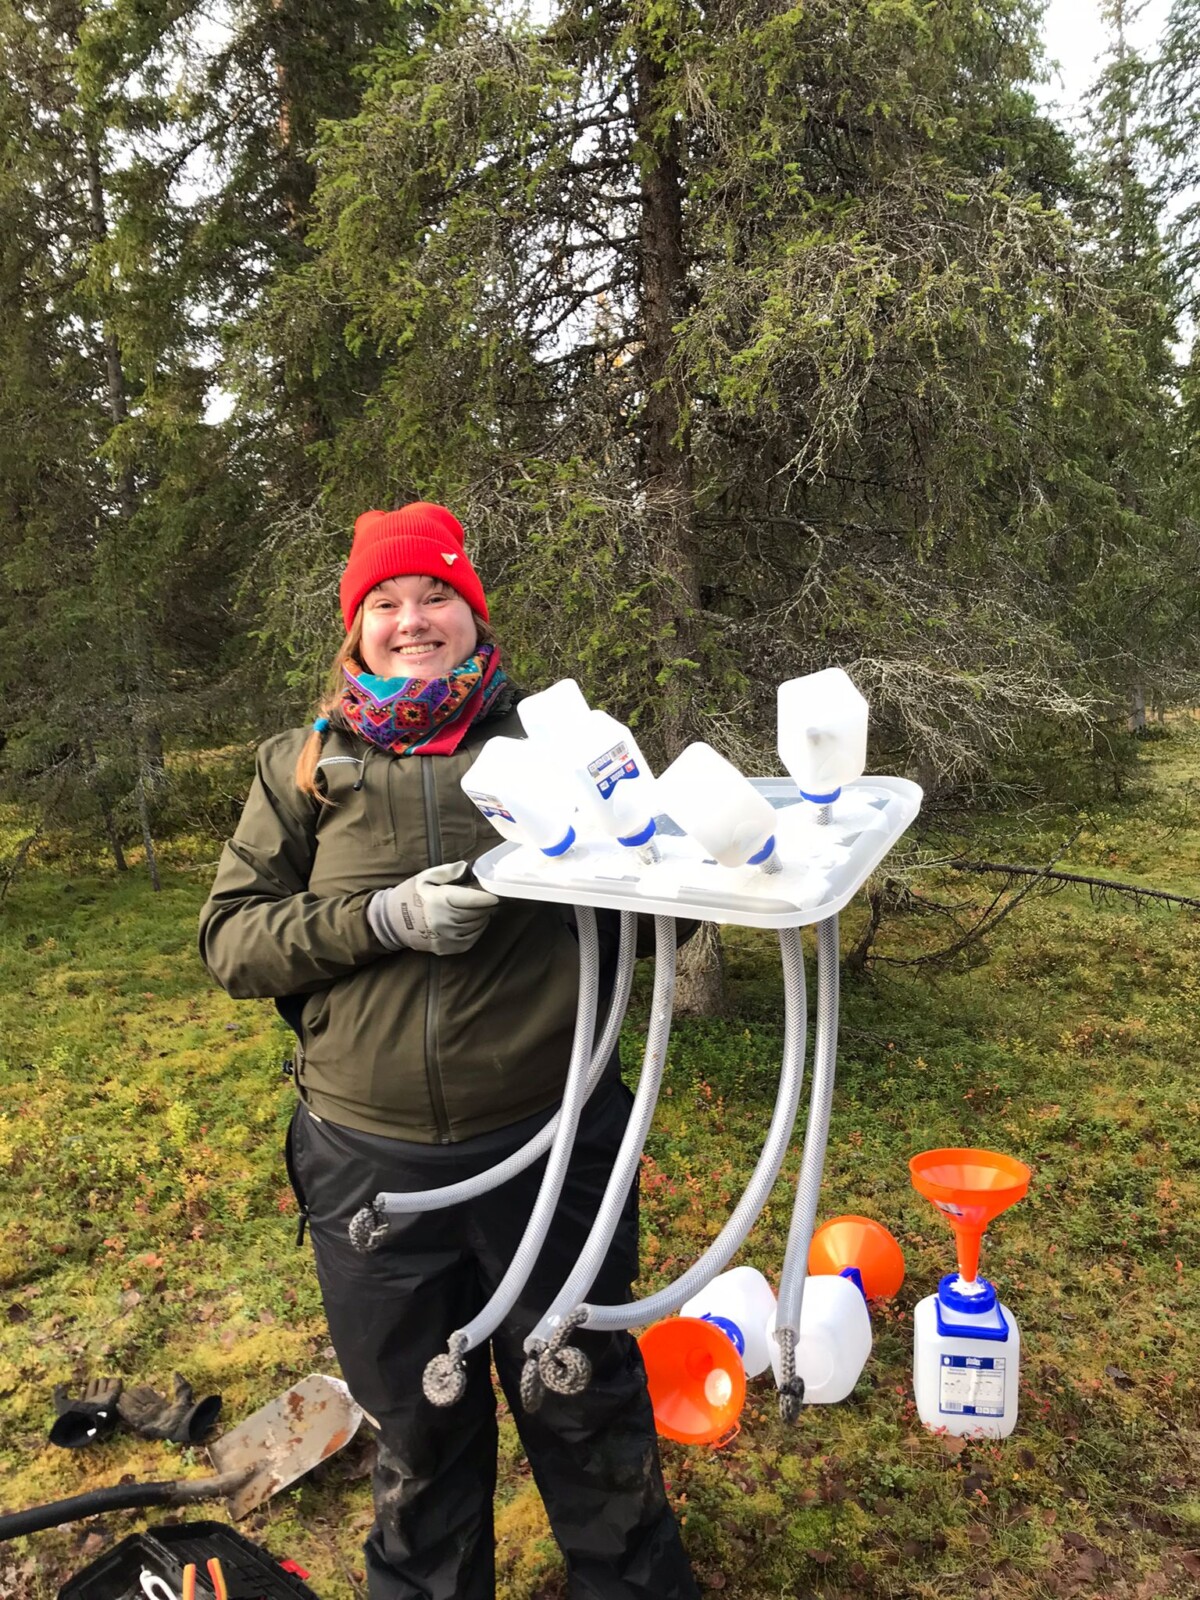
Figure 6: Me (Charlotte Ditlevsen) and my PCS before finalizing the installation. See the curled-up wicks hanging from the tubes and the sample collection bottles on top of the lid. [Credits: Maiju Ylönen]
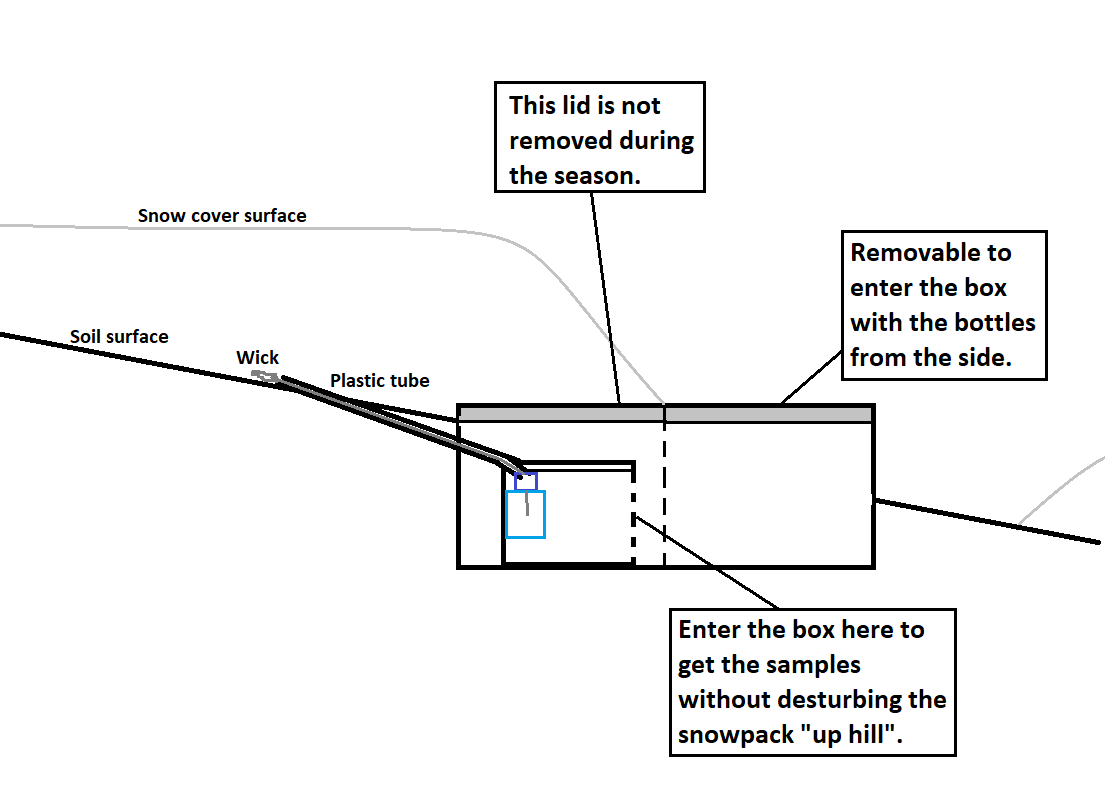
Figure 7: A conceptual drawing of the PCS setup. [Credits: Charlotte Ditlevsen]
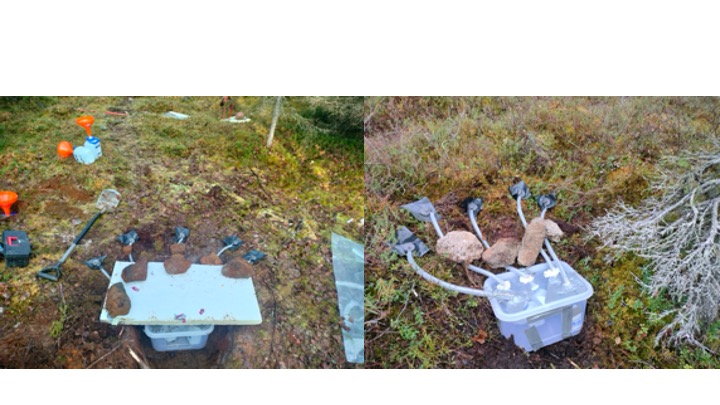
Figure 8: Examples of the inexpensive, hardware store bought items for the Passive Capillary Samplers with five wicks. The setup to the left is in flat terrain where digging was necessary, whereas the picture to the right shows the setup in a high-sloped terrain where no digging was necessary. Vegetation was removed which helped keep the PCS in place, but rocks and or wood could do the same. [Credits: Charlotte Ditlevsen]
Funnels
The funnel setup (Fig. 9) is probably one of the simplest setups. It requires a sample collector (a large bottle), a funnel, some mesh for on top of the funnel and glue to put it all together. The funnel is dug into the ground before the frost and snow arrive and left until the snow has melted by which it will provide a bulk sample of the melted snowpack. The sample would lose the difference between early and late melt fingerprint but it could potentially provide information on specific melt scenarios such as a quick melt.
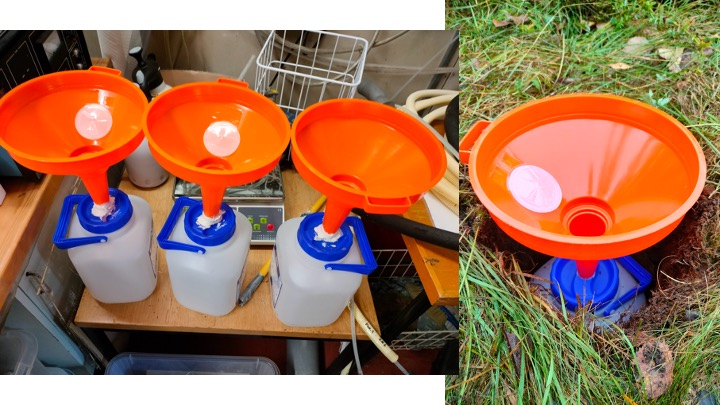
Figure 9: Funnels attached by glue to a 5L bottle. The funnels were covered by a metal mesh to prevent animals from entering and for an event melt later in the season. [Credits: Charlotte Ditlevsen]
The Dustpan Instant Snow Lysimeter
The instant snow lysimeter is a bit of a desperate attempt to allow us to sample meltwater even though no setup was installed before the snow arrived. We came up with a cheap, simple, and hopefully functional setup that includes a dustpan, a tube, and a sample collector (Fig. 10).
The setup should work by digging into a snow pit and insert the dustpan and tube along the bottom as far as possible into the snowpack to avoid complications with the exposed pit wall. However, there are several potential challenges with this: 1) not being able to see the surface of the insertion – will the dustpan follow the bottom of the snow cover? 2) will the tube get clogged on the way in and thereby prevent melt from running through to the sample collector? 3) is the snowpack disturbed too much by the insertion? 4) will enough meltwater enter the tube for analysis? And so on. Many questions are left unanswered until we have tested it and perhaps that is part of the adventure.
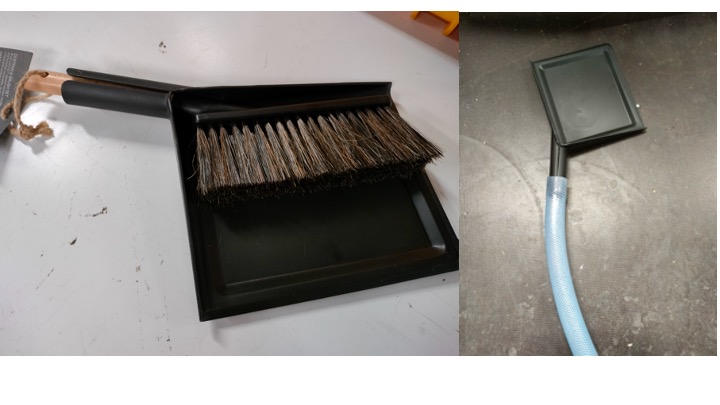
Figure 10: A simple instant lysimeter setup with a dustpan and a tube for collecting meltwater. The dustpan can be pushed in under the snowpack and function as snow lysimeter without having installed it before the snow arrives. [Credits: Charlotte Ditlevsen]
Testing the different snow meltwater collector setups
All but one (the instant setup) of the instruments that we work with are installed before the snow arrives. Many of them also require digging into the soil, which makes them less to not-at-all useful, e.g. in regions with permafrost. This made us think about how to approach that challenge and we tried to modify two of the setups to accommodate those environments. We have chosen to try and capture more samples providing us with a higher resolution than what a bulk sample provides. So all setups, except the funnel setup, are built to be able to handle that.
What’s next?
This is just the beginning. We are working on analysing the global snowmelt data that we have collected from published data and collaborators. This, we expect, will tell us more about whether melt signal is varying in between snow regimes (e.g., mountains, plains, tundra, etc.). For our own setups we expect that by May-June this year we have become wiser in regard to how the different setups performed in the different locations and what results we get from analysing the meltwater. Based on those results we will be revisiting our snow sampling methodology catalogue and edit it by implementing the new results and findings. The joys of fieldwork! If you recognize this problem-solving in the field, I hope you found our ideas presented in this blog helpful. The adventure has just begun so I guess I will leave you with it here. To be continued…
Further reading
- Marttila, Hannu et al., 2021: “Subarctic catchment water storage and carbon cycling – Leading the way for future studies using integrated datasets at Pallas, Finland.” Hydrological Processes 35.
- Noor, K., Marttila, H., Welker, J., Mustonen, K., Klöve, B., Ala-aho, P. (2023). “Snow sampling strategy can bias estimation of meltwater fractions in isotope hydrograph separation.” Journal of Hydrology. 627.
- Penna, D., Ahmad, M., Birks, S., Bouchaou, L., Brenčič, M., Butt, S., Holko, L., Jeelani, G., Martínez, D., Melikadze, G., Shanley, J., Sokratov, S., Stadnyk, T., Sugimoto, A., Vreča, P. (2014). “A new method of snowmelt sampling for water stable isotopes.” Hydrological Processes. 28.
- J. Klaus, J.J. McDonnell, (2013) “Hydrograph separation using stable isotopes: Review and evaluation.” Journal of Hydrology, Vol. 505.
Edited by Maria Scheel & Lina Madaj
 Charlotte Ditlevsen is a PhD Student at the University of Oulu, Finland. She is investigating the role of meltwater in snow influenced hydrological systems. With her research she develops sampler instruments for snow, produces protocols for snow sampling, works with stable water isotopes and creates meltwater network collaborations. She has a background in extreme statistics, flood risk assessments and wetland restorations, before coming to do her PhD work in Finland. Read more on Charlotte’s LinkedIn or via the university page Charlotte Ditlevsen | University of Oulu.
Contact Email: charlotte.ditlevsen@oulu.fi