Understanding what is going on inside an ice shelf is important for many reasons. But mostly, it allows us to better understand their contribution to sea level rise, and to understand how they are changing and evolve over time, with our changing climate. Geophysical methods offer a means to be able to see inside an ice shelf, and get an idea of their properties. Read on to find out a bit more about how they work.
Introduction
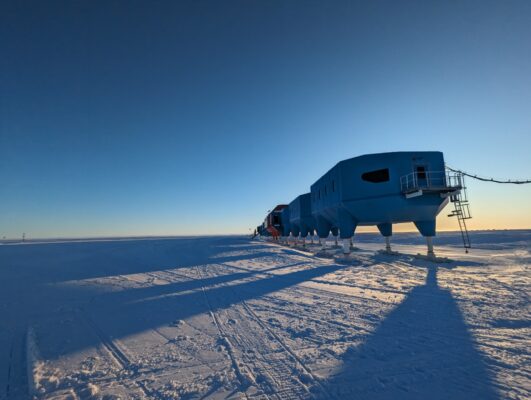
Halley VI research station (Figure 1) might look like a set from a sci-fi film, or you could be mistaken for thinking it’s a new thunderbirds spaceship (as my dad liked to think). But instead, it is one of the British Antarctic Survey’s (BAS) research stations on the Brunt Ice Shelf in Antarctica.
Halley VI is a module-based research facility built on skis, so that if the station needs to be relocated due to the ice shelf’s evolving features, it can be! In 2013, a big fracture in the ice shelf known as Chasm 1 started to grow, which meant the station needed to be moved (Read more about the great Halley migration of 2016-2017 here!). It took only a few months from the cracks initiation to getting the relocation project underway.
Being based on an ice shelf, Halley is an excellent base for scientists who want to better understand the structure of ice shelves, specifically, the ice that they are made up of and how these fractures that form evolve with time. Emma Pearce, a researcher with BAS travelled down to the Brunt Ice Shelf this year for 11 weeks. Her goal was to do a mixture of geophysical surveys and ice core drilling to try learn more about these features. Emma is part of the RIFT-TIP project, a project that is trying to better understand the Rates of Ice Fracture and the Timing of Tabluar Iceberg Production. So where better to go than an ice shelf that has ice fractures and produces tabular icebergs?!
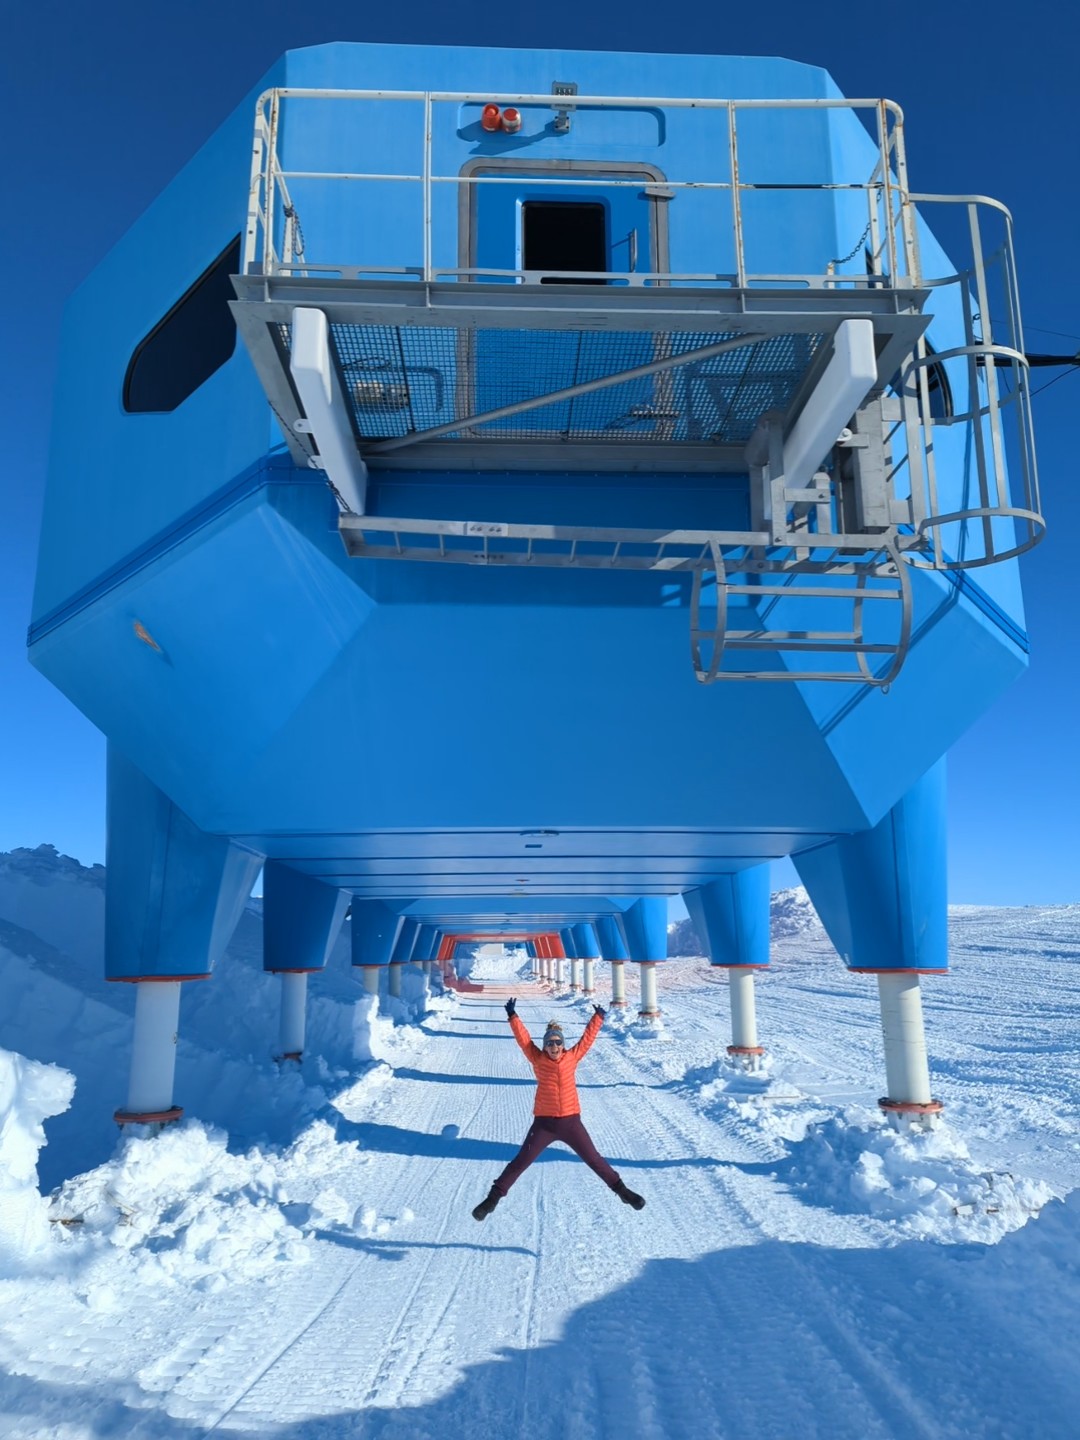
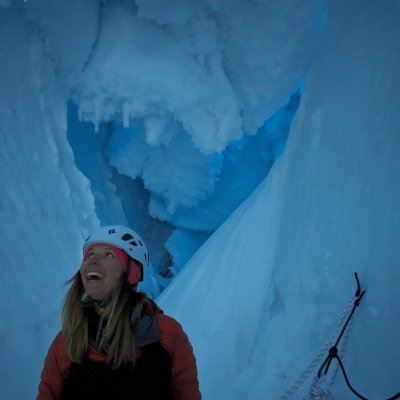
Figure 2: Emma has a look below Halley, much easier than looking below an ice shelf!
How do we ‘look’ inside of an ice shelf?
It’s much easier to look under a research station (as Emma so kindly shows us!) than it is to look under an ice shelf! For scientists to be able to better understand and predict how ice shelves evolve with our changing environment using computer models, we have to provide the modellers with a better understanding of the current ice dynamics and internal properties. But how do we know what is going on hundreds of meters below the surface of the ice? Well, geophysics can help us!
Seismic Surveys
Seismic surveys use geophones, small microphones that listen to sound waves that travel through the ice. When sound travels through the air, it always moves with the exact same speed, (330 m/s). However, when sound travels through ice and other materials, it’s velocity changes depending on the properties of the medium it is going through, e.g. it’s density and temperature. For really hard, cold ice, we expect the sound to travel fast, around 3800 m/s, or for really soft, fluffy snow, it can travel as slow as 400 m/s. Geophysicists can use this information to build a model of the ice shelf, either using sound waves from artificial sources, like from a big hammer hit to the ground, or from natural events like icequakes (like an earthquake, but in ice, caused by the release of stress from flowing ice). We record how long the waves take to reach the geophones, and from this, we can build a picture of the internal structure of the ice!
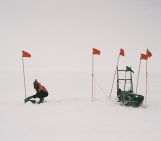
We are also interested in figuring out where exactly the icequakes are happening in the ice shelf. We use the seismic data to produce maps of the icequakes, and from this we can learn about how the ice shelves fracture and evolve with time. This year on the ice shelf, Emma visited a big fracture known as Halloween Crack, where she installed 11 geophones at the very end of the crack to listen to the ice. This will help Emma and the other scientists on the RIFT TIP project to figure out how the crack is growing.
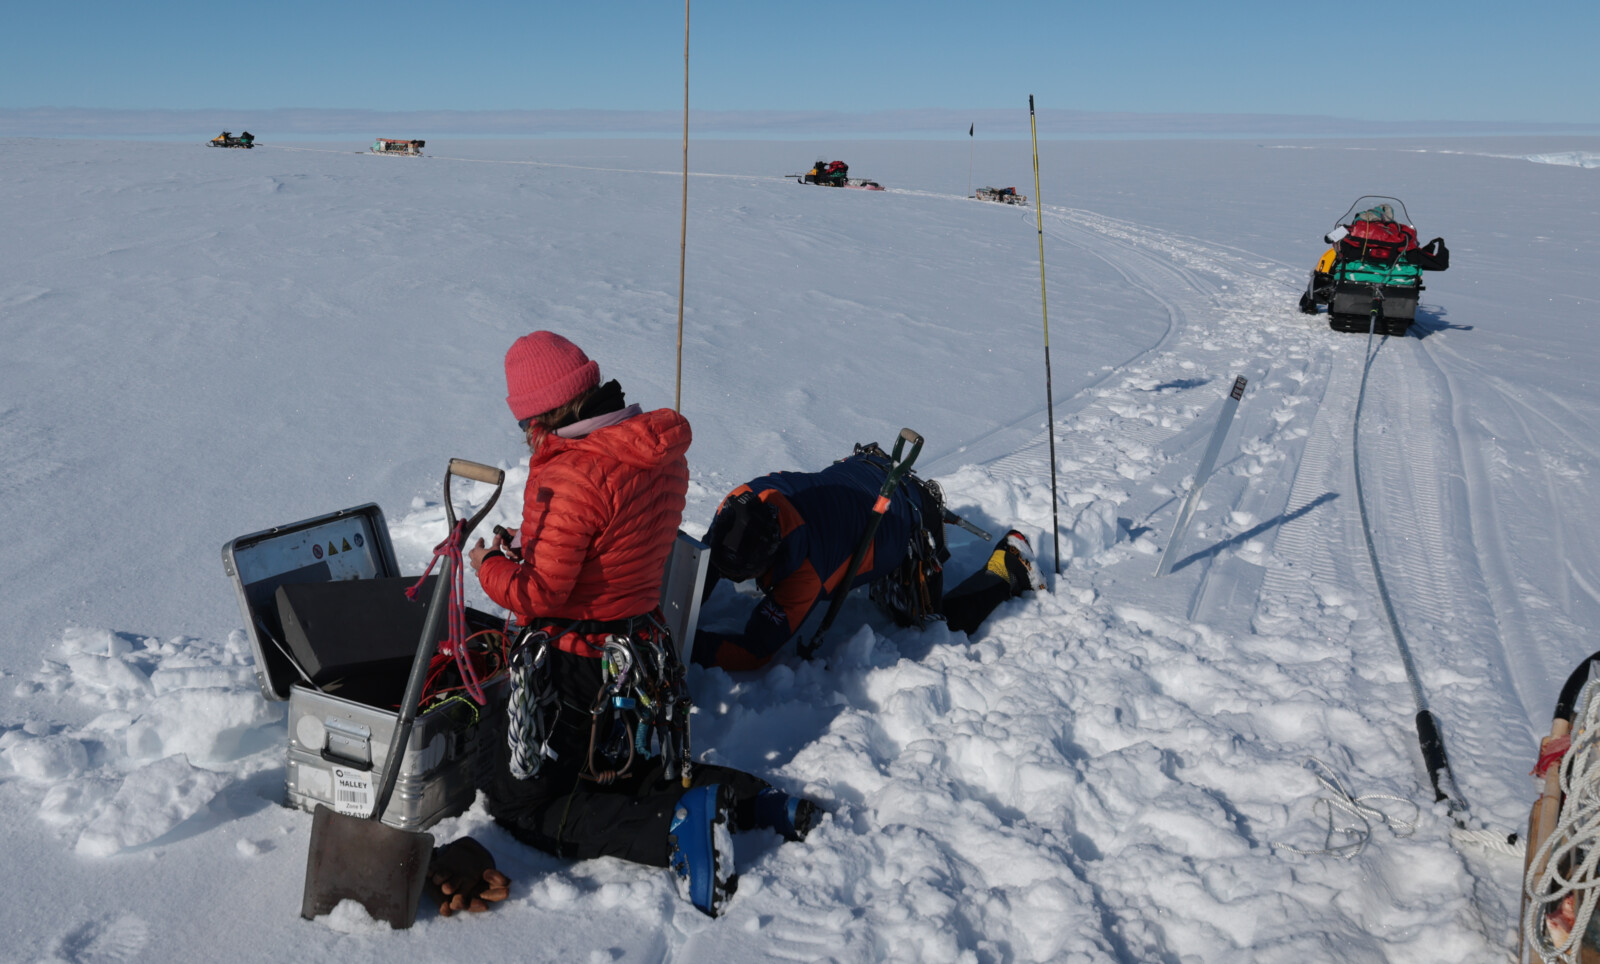
Figure 3: Emma deploying a seismometer at the tip of Halloween crack, to try listen for icequakes!
Ground Penetrating Radar
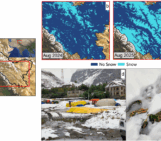
Radar surveys are similar to seismic ones, but instead of sending sound waves through the ground, they send electromagnetic waves (i.e. radar waves!). These waves are sensitive to different properties in the ice, such as permittivity and electrical conductivity. We used radar data this year on the Brunt Ice Shelf to produce a map of the features below the surface, allowing us to see features hidden from the surface, like the very end of Halloween Crack. Radar also allows us to see the layering with the ice shelf, caused by the yearly snowfall and compaction. This data helped us to decide where to place our seismometers and where to drill into the ice.
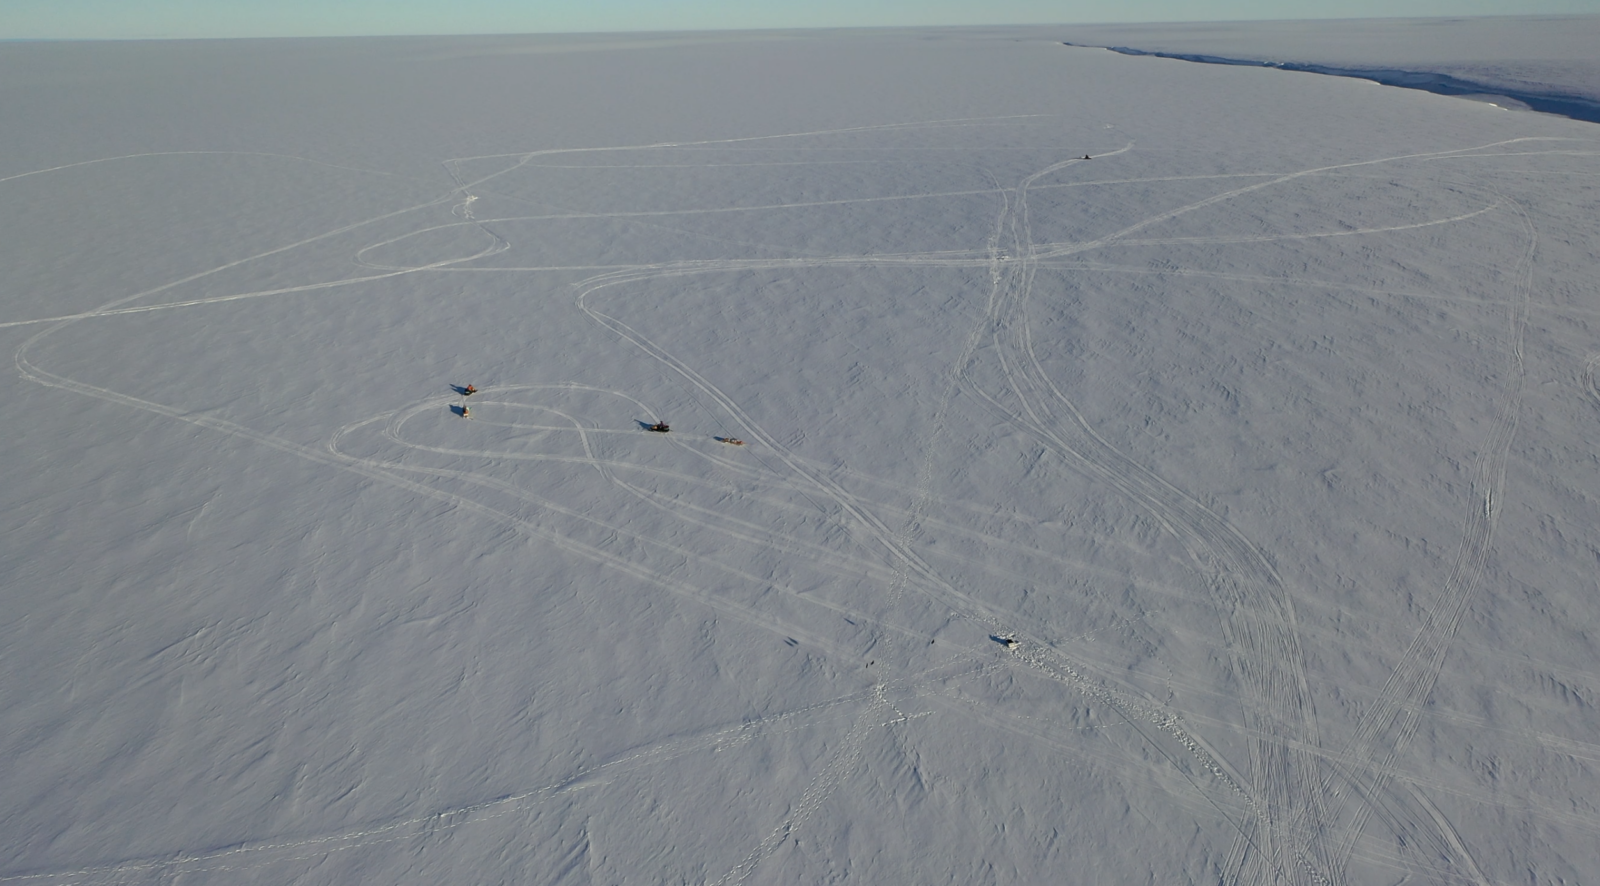
Figure 4: Scientists towing the radar using a skidoo to map the layers below the surface and identify where the very tip of Halloween crack begins.
Drilling
Perhaps one of the best ways to see what is happening below the surface, is to drill inside and remove the ice and take a look! This is what Emma did at Halley this year, too. The Brunt Ice Shelf is made up of two distinctly different types of ice. One type that is very old, hard, and has come off of the continent into the ocean breaking up into big ‘continental’ blocks of ice. The other type of ice is the ‘glue’ that freezes these continental blocks back together to make up the ice shelf. The ‘glue’ is made up of sea ice with a thick layer of snow on top. By drilling into both these different types of ice, we hope to be able to understand how the ice varies in strength and other physical properties. Using an ice core drill, the team were able to drill down to over 100 m below the surface and recover ice cores from hundreds and thousands of years ago. This ice then gets sent all the way back to England (making sure it doesn’t melt on the way!), where we study it in the lab using large mechanical presses to squeeze and crush the ice, and really get a better idea of how strong it is!
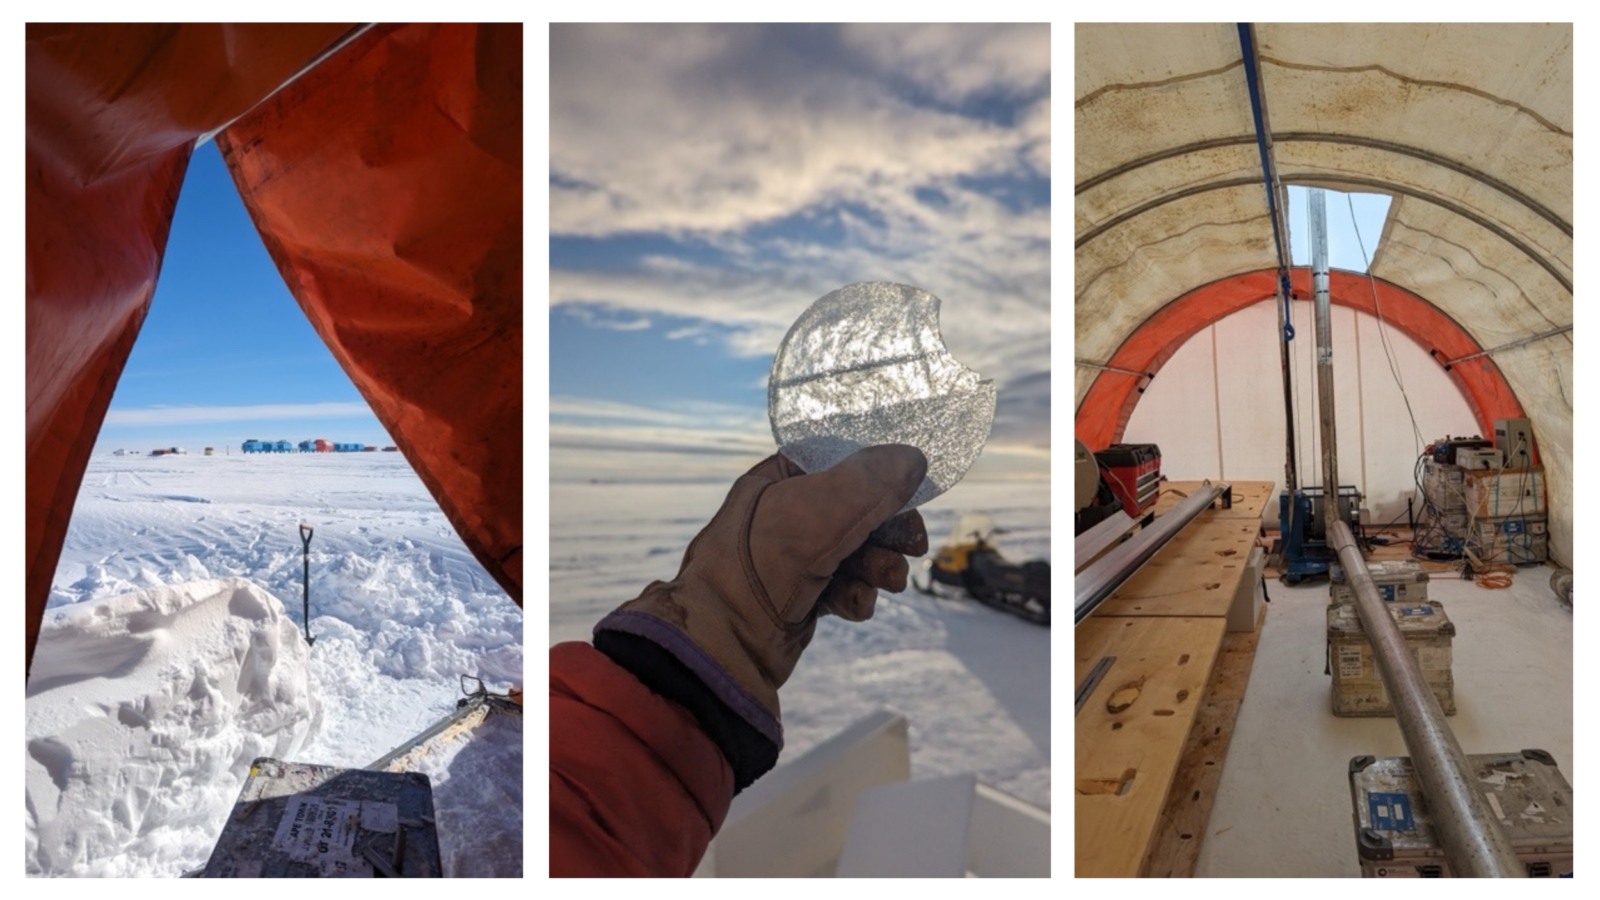
Figure 5: An ice core taken from the drill tent, with a beautiful view of Halley research station!
Summary
Now, after fieldwork, it is time to bring all the different datasets together in order to learn how the ice fractures and evolves. But this usually takes a while! Combining all these different methods allows scientists to get a really detailed picture of an ice shelf. We can learn all about what is going on inside the ice, how the ice is breaking up, how strong it is, how it flowed to get to its current position, how old it is, and much, much, more! Geophysics provides us a secret insight into the heart of an ice shelf.
Edited by Maria Scheel
 Emma Pearce is a post-doctoral researcher at the British Antarctic Survey. She spends her time ‘looking’ inside ice using geophysics. She is a regular editor and writer for the EGU Cryosphere blog. You can see her post about her field work adventures, research and blogs over on X/Twitter @emm_pearce