Declining sea ice in the Arctic is definitely one of the most iconic consequences of climate change. In a study recently published in Science, Dirk Notz and Julienne Stroeve find a linear relationship between carbon dioxide (CO2) emissions and loss of Arctic sea-ice area in summer. Our image of this week is based on these results and shows the area of September Arctic sea ice lost per inhabitant d ...[Read More]
Image of the Week – For each tonne of CO2 emitted, Arctic sea ice shrinks by 3m² in summer
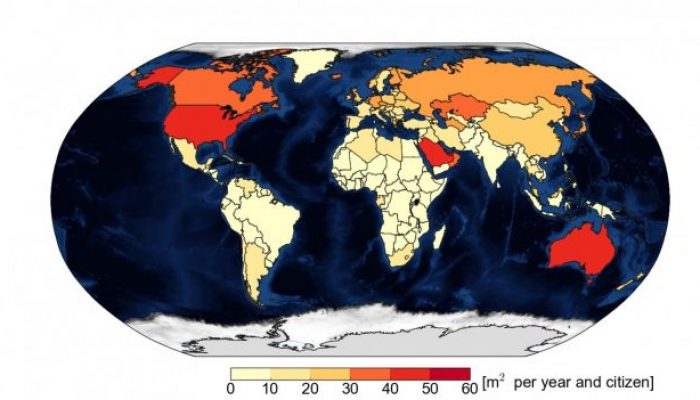
Mean area of Arctic September sea ice lost by CO2 emissions of each citizen for each country of the world in 2013. These results are based on the observed trend of 3 m² sea-ice area loss per tonne of CO2 emitted [Credit: adapted from Notz and Stroeve (2016), Fig.S1]