Located in the North Atlantic Ocean, just south of the polar circle, Iceland is a highly fascinating land. Covered by some of the largest glaciers in Europe and hosting active volcanoes, geothermal sites and subglacial lakes, it is extremely dynamic in nature and ever changing. With this Image of the Week we will tell you a bit about the changing ice caps of Iceland and how we can monitor them from space!
Icelandic ice caps since the mid-1990s
Iceland enjoys a mild and moist climate because of the relatively warm and saline Irminger current transporting heat to its southern coast, although the cold East Greenland and East Icelandic currents may cause sea ice to form to the north. Iceland’s ice caps, which receive abundant precipitation from North Atlantic cyclones, cover about 11% of the land, and contain ~3600 km2 of ice. If they completely melted they would contribute 1 cm to Sea Level Rise (SLR).
In the period 1995-2010, Icelandic glaciers shrank every year and lost mass at an average rate of 9.5±1.5 Gton a-1 – generally reflecting higher summer temperatures and longer melting seasons than in the early 1990s (Björnsson et al., 2013). Importantly, in recent decades Iceland has been the second largest source of glacier meltwater to the North Atlantic after Greenland and its peripheral glaciers. Furthermore, surge-type outlet glaciers – which have unpredictable dynamics – are present in all Icelandic ice caps and represent as much as 75% of the area of Vatnajökull (Bjornsson et al., 2003), the largest ice cap in Europe by volume. Therefore, it is important to continuously monitor Icelandic ice caps (>90% of the whole glaciated area) at high spatial resolution. Glaciological field surveys can yield accurate measurements and are routinely performed in Iceland on all ice caps and most glaciers. However, it is not always feasible to use field methods, depending on the remoteness and size of the glacier (e.g. several glaciers and ice caps in the Arctic). Continuous monitoring of such hardly accessible areas can be achieved from space at high spatial resolution.
Continuous health check from space
Since 2010, the ESA CryoSat-2 (CS2) mission has been fundamental in retrieving ice elevation data over glacial terrain characterised by complex topography and steep slopes – notoriously hard to monitor via satellite. CS2’s radar altimeter provides the elevation of the Point-Of-Closest-Approach (POCA) – the point at the surface closest to the satellite on a straight line – every ~400 m along the flight track. The main novelty of this mission is the use of a second antenna, which allows the use of interferometry across-track to accurately infer the location of a surface reflection in presence of a slope (read more about it here). Additionally, a new and exciting application of CS2 interferometric capabilities is that we can exploit the echos after the POCA, i.e. the reflections coming from the sloping surface moments after the first one. This approach generates a swath of elevations every ~400 m and provides up to two orders of magnitude more elevation data than with conventional POCA processing (Fig. 2; Gray et al., 2013, Foresta et al., 2016).
Since 2010, the ESA CryoSat-2 (CS2) mission has been fundamental in retrieving ice elevation data
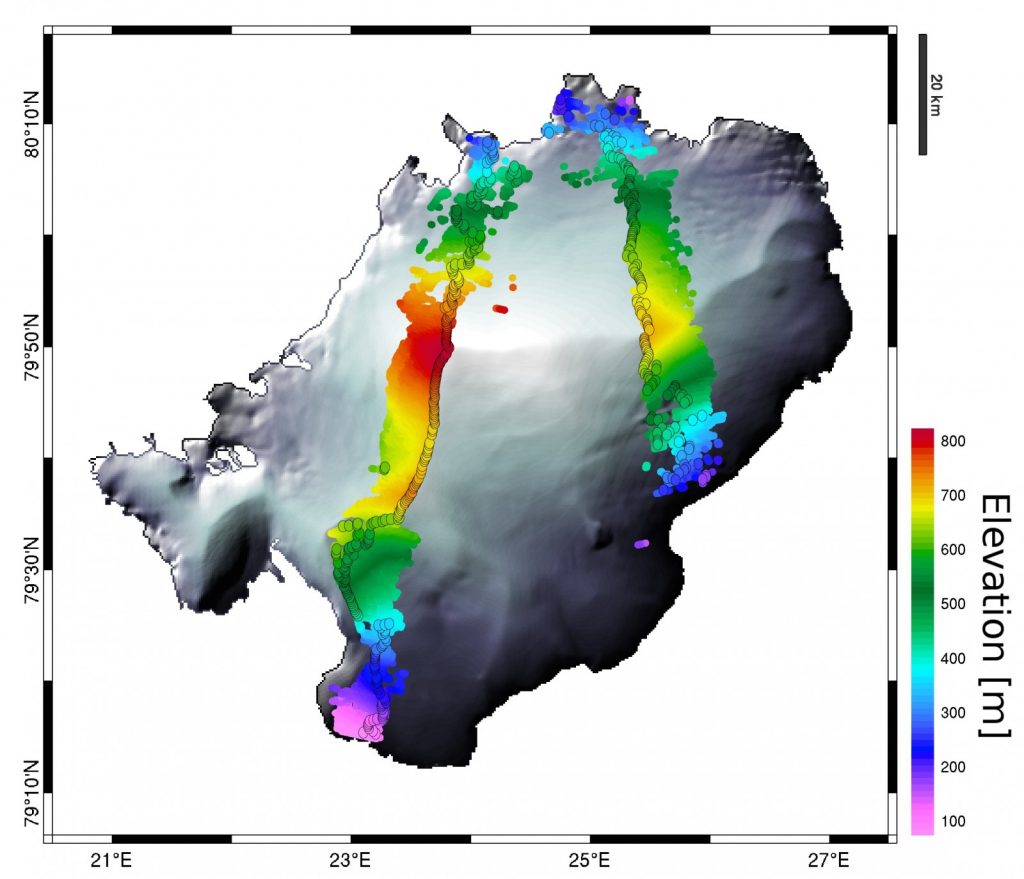
Figure 2: Example of the improved elevation data using CS2 swath-processing. CS2 swath data (colors) and conventional (circles) heights over the Austfonna ice cap (Svalbard) for two satellite passes. Swath processing delivers up to two orders of magnitude more elevation data. [Credit: Dr. N. Gourmelen,University of Edinburgh, School of GeoSciences]
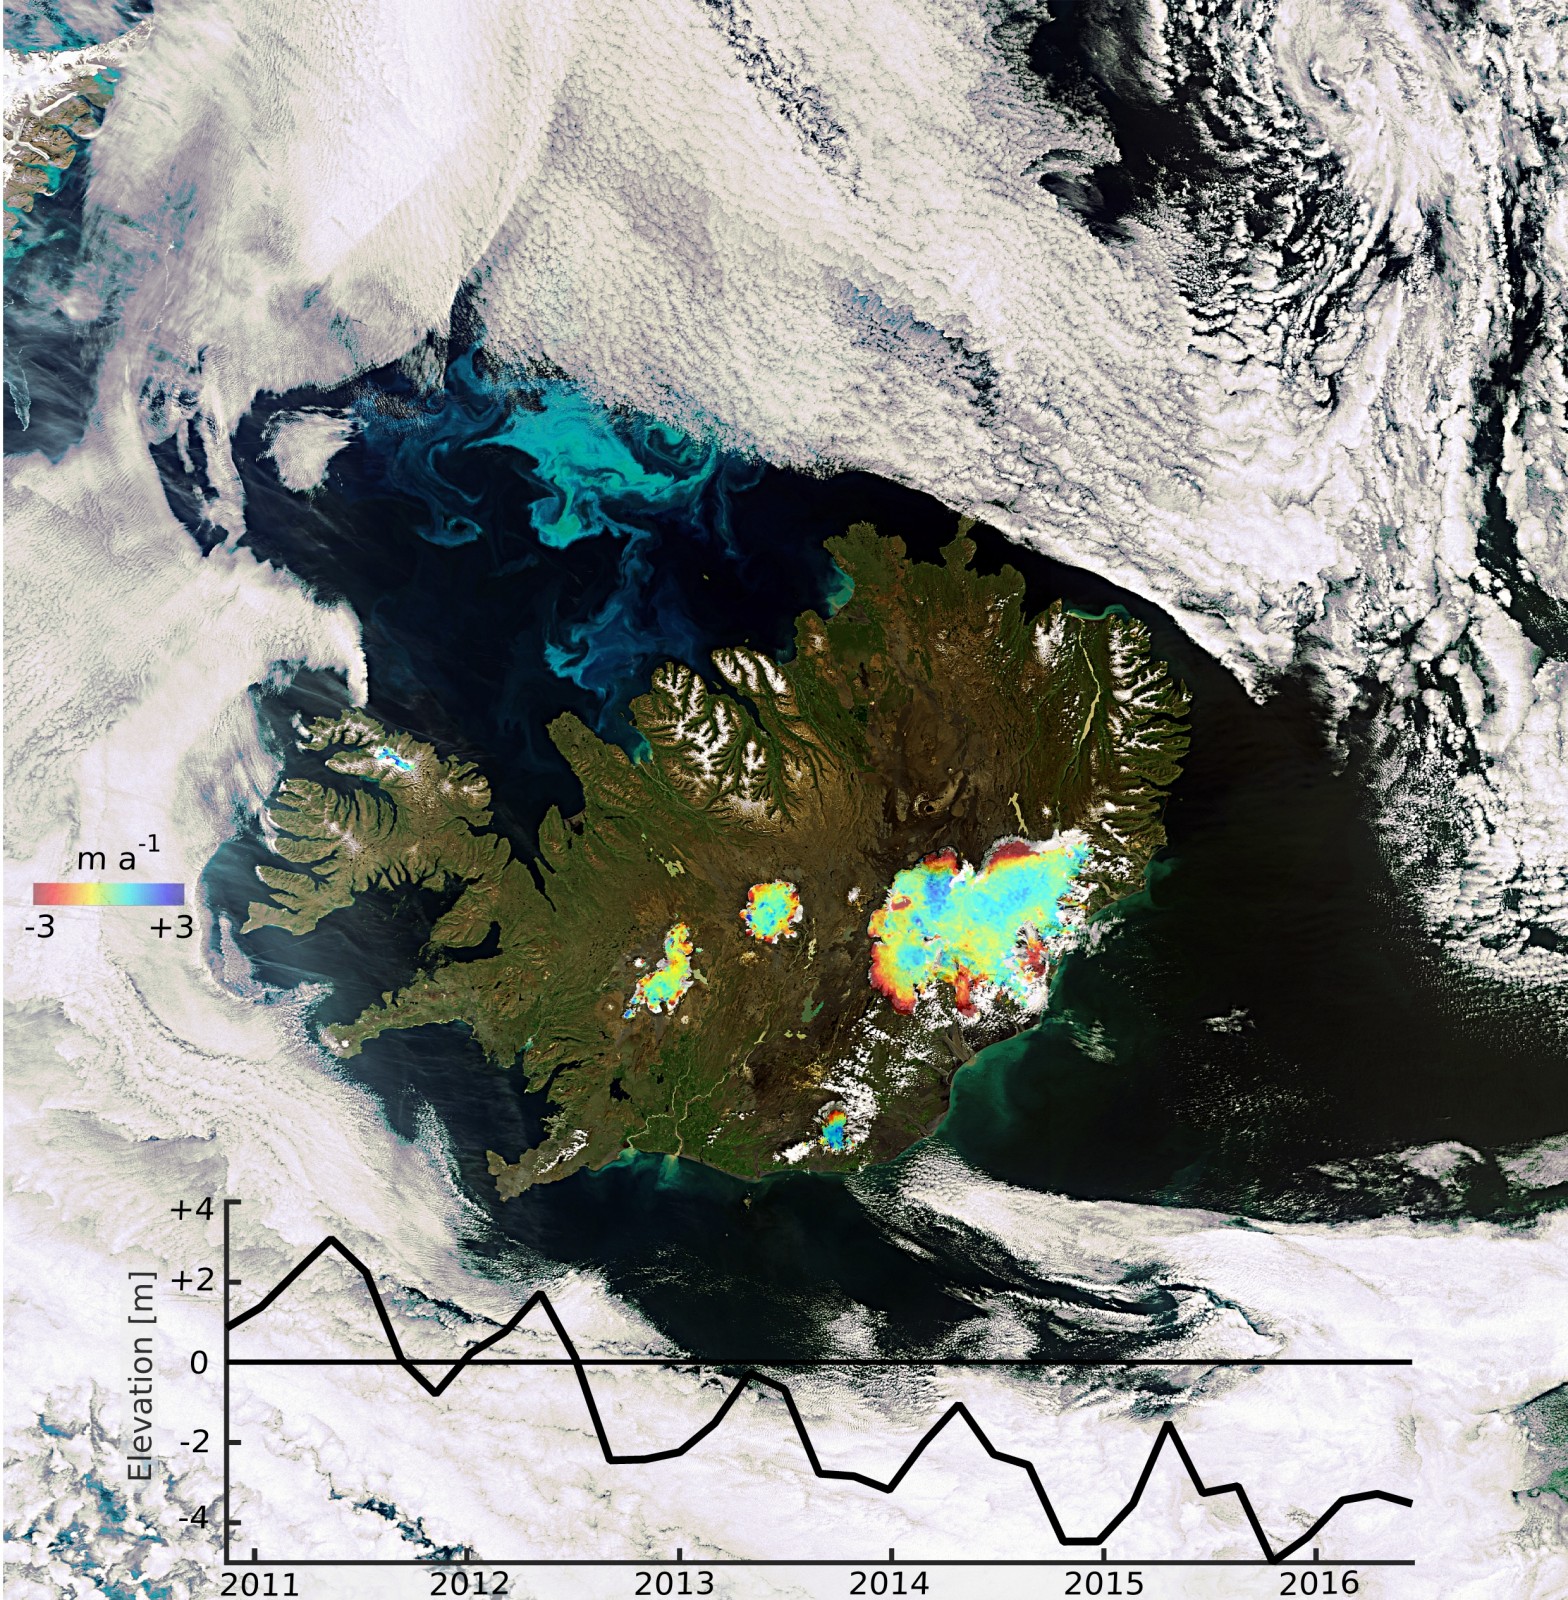
This rich dataset can be used to generate maps of surface elevation change rates at sub-kilometer resolution (Figs. 1 and 3). These maps show extensive thinning of up to -10 m a-1 in marginal areas of Iceland’s ice caps, while patterns of change are more variable in their interior. Fig. 3 shows the difference in spatial coverage between the POCA and Swath approaches, with the former sampling preferentially along topographic highs (see for example the Langjökull ice cap in Fig. 3). Using these high resolution maps, it is possible to independently infer the mass balance of each ice cap purely from satellite altimetry data. Based on CS2 swath-processed elevations, between glaciological years 2010/11 and 2014/15 Iceland has lost mass at an average rate of 5.8±0.7 Gton a-1 contributing 0.016±0.002 mm a-1 to SLR (Foresta et al., 2016). The rate of mass loss is ~40% less than during the preceding 15 years, partly caused by Vatnajökull (63% of the total mass loss) having had positive mass balance during the glaciological year 2014/15 due to anomalously high precipitation. Langjökull, with widespread thinning up to the ice divide (Figs. 1 and 3), is the fastest changing ice cap in terms of mass loss per unit area.
between glaciological years 2010/11 and 2014/15 Iceland has lost mass at an average rate of 5.8±0.7 Gton a-1 contributing 0.016±0.002 mm a-1 to SLR
Beside estimating mass change at the ice cap scale, the novel swath approach demonstrates the capability to observe glaciological processes at a sub-catchment scale. Different accumulation and thinning patterns over Vatnajökull and Langjökull, for example, are directly related to past surges or subglacial volcanic eruptions, some of which happened decades ago. Their long term lingering effects on the ice cap topography are now visible from space and as the satellite data record extends we will be able to gain an increased understanding of how these effects evolve over time.
Figure 3 – Comparison between swath-processed (Swath) and conventional (POCA) surface elevation change rates over the six largest ice caps in Iceland, representing 90% of the glaciated area. V (Vatnajökull), L (Langjökull),H(Hofsjökull),M(Mýrdalsjökull), D (Drangajökull), and E (Eyjafjallajökull). The inset shows the location of individual elevation measurements by using Swath and POCA approaches over Langjökull. [Credit: After Foresta et al. (2016).]
Edited by Emma Smith
 Luca Foresta is a PhD student in the Glaciology and Cryosphere Research Group at the University of Edinburgh (@EdinGlaciology), and his research focuses on improving CryoSat-2 processing as well as exploiting swath-processed CryoSat-2 data to quantify surface, volume and mass changes over ice caps.
Pingback: Cryospheric Sciences | Image of the Week — The ice blue eye of the Arctic